Category Archives: Polling

The Latest Gallup Poll: Are Democrats Gaining Momentum?

Another nice teaching moment, this one courtesy of Jay Cost at the Horserace blog and Mark Blumenthal at Pollster.com. Gallup released their latest generic ballot results under the headlines “Democrats Jump Into Six Point Lead on the Generic Ballot”.  

As the following table shows, this jump comes after many months of polling data in which Democrats either trailed or were tied (within the poll’s margin of errors) with Republicans in the generic question.

As I’ve blogged about before, the generic ballot question is a useful predictor of the number of House seats won by each party in midterm elections, so people pay attention to these results.   (Note, however, that Gallup is not yet using their likely voter screen – when they do, history suggests Republicans will gain about 5% over the results of their polling of registered voters.)

Not surprisingly, progressive bloggers like Tom Schaller at Fivethirtyeight.com and Andrew Sullivan – while issuing the usual caveats (it’s only one data point, it could be an outlier, etc.)  – jumped on these latest results as a possible sign that Democrats were regaining support among voters. Sullivan opined: “It is unwise to discount the intelligence of the American people – a trait more endemic among liberals than conservatives. The latest Gallup generic poll is striking – because it suggests that voters in the end may vote on substance not spin and ideology.”

But what substantive issue explains the reversal in voter sentiment– was it the financial legislation that just passed Congress?  Voter backlash to the Republican handling (see Joe Barton) of the Gulf oil spill?  Belated recognition that the health care legislation is a good thing? Growing disgust with Republicans as the “party of  no”?

How about none of the above?  Yes, the six-point Democrat advantage lies outside the poll’s margin of error.  But as Blumenthal reminds us, Gallup’s results are based on probability sampling – remember, each Gallup poll is followed by some version of this methodological blurb:  “one can say with 95% confidence that the maximum margin of sampling error is ±3 percentage points”.

What does this mean?  Essentially, if Gallup repeatedly sampled the population of registered voters, approximately 95% of the time the sample results would fall within 3 percentage points (plus or minus)  of the actual proportion of Democrat and Republicans supporters in the generic ballot question.  Put another way, 5% of the time the Gallup poll results might fall more than 3 percentage points from the actual proportion of Republican and Democrat supporters.  That means we can expect, very rarely, a result that lies outside the margin of error even if there’s been no actual opinion change.

Now, we can’t know what that actual  number of Republican and Democrat supporters is  – Gallup can only estimate it by taking a random sample of all registered voters.  Let’s assume, however, that the actual support for the Democrat on the generic ballot question is pretty close to the average Democratic support among registered voters, as polled by Gallup for the last 20 weeks.  That average number is 45.6%.  In that 20-week period, Blumenthal finds only one poll that lies more than 3% (plus or minus) from this average – and that is the most recent poll showing 49% support for Democrats in the generic ballot.   Note that this most recent result lies is just barely (.4%) outside the margin of error.

Bottom line?  I can understand why Sullivan equates wisdom with support for liberal policies, and why his world view might color his interpretation of the polling results.  But, as always, we need to separate our personal preferences from our analysis of the facts.  It’s possible Democrats are picking up support among voters as we move closer to the midterm.  It’s also possible, however, that this is a perfectly predictable statistical fluctuation associated with polling based on random sampling, and that there’s been no real change in voter sentiment at all.  We won’t know for certain until several more polls are in.  But I would be cautious about discarding 20 weeks of results on the basis of a single poll.

In the meantime, skepticism rather than certitude should be your watchword.

Addendum: I’ve tweaked the wording of my original post in order to better describe the meaning of the phrase “margin of error” in the context of probability sampling.  The substance of the post – that we can’t be sure this most recent result indicates a real shift in voter sentiment – hasn’t changed.

Is the Public Stupid? When A Chart Is Not Worth A Thousand Words

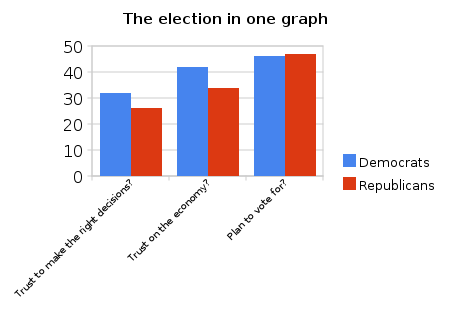
This item from yesterday’s Washington Post caught my eye as a useful teaching moment.  Ezra Klein posted this graph, based on this most recent Washington Post/ABC Poll,  under the label “A chart is worth a thousand words”:

It’s not clear what Klein’s point is, but presumably he means to point out just how illogical voters are, since they trust Democrats more than Republicans on handling the economy and to make the “right decisions”, and yet a plurality (by a slim percentage) are planning to vote Republicans into office.

There’s only one problem with this graph. If you actually go to the data in the poll from which Klein constructed it, you’ll see that the first two bars are based on a sample of all adults, while the last bar, which graphs the partisan breakdown of responses to the question “who do you plan to vote for?” is based on a sample of only registered voters.

Longtime readers have heard this refrain before, but it bears repeating for those who have just tuned in:  samples based on registered voters tend to skew slightly more Republican than do samples based on all adults.  The basic reason is that samples of all adults include more Democrat supporters who are less likely to vote. Or, to put it another way, Klein is comparing apples to oranges.

How big is the difference? It varies, of course, from poll to poll depending on sampling procedures, etc. Ideally, of course, we’d test the premise by having polling outfits conduct split sample surveys that compare response rates of both likely and registered voters to all adults.   That’s expensive, however, so most polling outfits do one or the other.  (Presumably WaPo switched to registered voters from all adults on the “who are you planning to vote for?” question because for this question they wanted to sample those most likely to vote, rather than all adults.)

However, we can get some leverage on the issue by looking at past Washington Post polls that have polled both groups in close temporal proximity, if not at the same time.   Here’s an example.

18. (ASKED OF REGISTERED VOTERS) If the election for the U.S.
House of Representatives in November were being held today,
would you vote for (the Democratic candidate) or (the Republican
candidate) in your congressional district? (IF OTHER, NEITHER,
DK, REF) Would you lean toward the (Democratic candidate) or
toward the (Republican candidate)?
NET LEANED VOTE PREFERENCE
               Dem     Rep     Other    Neither    Will not       No
               cand.   cand.   (vol.)    (vol.)   vote (vol.)   opinion
7/11/10  RV     46      47       *         2           *           5
6/6/10   RV     47      44       2         2           1           4
4/25/10  RV     48      43       1         2           1           6
3/26/10  RV     48      44       1         2           *           4
2/8/10   RV     45      48       *         3           *           4
10/18/09 All    51      39       1         3           2           5

Note the big difference when WaPo switches from sampling all voters, in October, 2009 versus a sample of registered voters in February, 2010.  Democrats go from being preferred by 12% to being behind by 3% – a net shift of 15%.  Yes, the polls were four months apart, so it’s possible voters’ preferences simply shifted that much in the intervening time.  Note that we don’t see any comparable shift in subsequent months, however.

Next, let’s look at previous WaPo/ABC polls that asked respondents which party they trusted more to handle the economy.  Fortunately, in September, 2002 WaPo asked a sample of all adults “Which political party, the (Democrats) or the (Republicans), do you trust to do a better job handling the economy?”  In the following month, they asked this of likely voters and then two months later of all adults again. Note that likely voters tend to skew Republican even more than registered voters. In September, the random sample of all adults indicated that they trusted the Democrats more, by 8%. The next month, when WaPo sampled only likely voters, the country changed its mind and now trusted Republicans more by 5%. That is, Republicans picked up 9% while Democrats dropped 4% in the switch from sampling all adults to sampling likely voters – a net switch of 13%.  Two months later, WaPo went back to sampling all adults, and Democrats closed the trust gap, essentially matching Republicans’ support.  The following table summarizes the results:

Date Democrat Republican Both Neither No Opinion
12/15/02 44 45 4 6 1
10/27/02  LV 43 48 3 3 2
9/26/02 47 39 3 6 5

Again, it’s possible that the public’s view toward the two parties’ ability to handle the economy changed from September to October, and then shifted back from October to December.  But it is more like, in my view, that the change reflects the difference response one receives when sampling all adults versus sampling likely voters.

This difference in partisan response rates for survey of all adults, registered voters, and likely voters, permeates all polls.  As evidence, look at this recent Times poll asking

“There will be an election for U.S. Congress in November. If you had to decide today, would you vote for the Democratic candidate in your district or the Republican candidate?”

Fortunately, the Times asked this of both likely voters and registered voters at the same time.  Here are the responses:

Population Sampled Democrat Republican Tea Party Other Unsure
Likely Voters 43 42 1 2 12
Registered Voters 47 43 1 3 6

Even when considering registered and likely voters, we see a slight Republican bias in the likely voter response.  Of course, the differences are small and close to the poll’s margin of error, so we can’t be sure the difference is driven by the different population samples.  But we can’t dismiss it either.  More generally, if you look at the dozens of polls that have asked versions of this “who will you vote for?” question this year, Republicans do better in surveys of likely voters versus registered voters, and better among registered voters than among all adults.  You can see for yourself here, by looking at the specific polls under the  2010 midterm section.

Now, let’s return to the original numbers on which Klein based his graph. The first table has the results for the question “who do you trust to make the right decision” asked of all adults.

Date Democrat Republican Both Neither No Opinion
7/11/10 42 34 3 17 5

And here are the percentages of the responses to “who do you trust to handle the economy?” again asked of all adults. (Respondents favoring Democrats in the first column, those favoring Republicans in the second.  I’ve omitted the “just some” and “not at all” categories to be consistent with Klein’s chart.)

7/11/10 32 26

What happens if you shift the net results to these two questions, say, about 5% toward the Republicans, which is consistent with the likely impact of surveying registered voters, as opposed to all adults?  Suddenly, given the 4% margin of error, Republicans are virtually tied with Democrats in terms of which party is preferred by voters for handling the economy, and for making the right decisions.  That is, the findings Klein cites in his chart that shows Republicans and Democrats in a dead heat in terms of registered voters’ preferences in the 2010 midterms seems quite consistent with the survey results for these two questions.

My point isn’t that Klein is wrong.  In fact, the public could be acting illogically by voting for the party they trust least to handle the economy or to make the right decisions.  However, the difference he cites might just be a function of sampling different populations. We can’t be sure.  If I’m Klein, I would likely point this out rather than present a chart in a way that implies the public is, as one person commenting put it, “Stupid.”

I should be clear: I’m not accusing Klein of any chicanery here.  It’s possible he didn’t notice that his first two survey responses were based on samples of all adults, while the third was based on a sample of registered voters.  More likely, in my view, is that he saw the chance to flag an “Aha!” moment, which makes for a good column, and simply didn’t bother checking the underlying data. Whatever  the explanation, it is a reminder (yes, I know, you’ve heard it from me a thousand times) that you can’t simply take a columnist’s word about how to interpret polling results.  You have to look at the poll itself.

Bottom line?  A chart may be worth a thousand words – but sometimes it doesn’t say anything at all.

It Really Is a Science

Politico’s David Catenese has picked up on (story here) the Research 2000-Markos Moulitsas fraud story I blogged about yesterday.  In addition to the Blanche Lincoln-Bill Halter Arkansas Democrat Senate race, Catanese reminds us that Research 2000 also published a poll in May suggesting Tom Campbell was soundly whipping (up 15%) Carly Fiorina in the California Republican Senate contest.  In fact, Fiorina crushed Campbell by 34%.

Catanese cites the story because these polls – even though they were wrong – helped drive the media narrative in both races.  He hints that they may have changed the campaign dynamics in ways that, had the race been closer, even altered the outcome.

My purpose in writing about this again, however, is slightly different.  I’m less concerned with the impact of these inaccurate polls on the races, and more interested in the debate regarding whether the company defrauded the Daily Kos founder by manipulating (making up?) data and generally failing to do what Kos hired them to do.  As someone who is a voracious consumer of polling data in this blog (as longtime readers know) but who does not produce surveys, I have a very strong interest in understanding the details of this story.   I  want to be sure that the results I present you are credible.

Of course, I realize that not all of you share my fascination with the nuts and bolts of polling, so I’m not going to delve too deeply into the details of the fraud case.  But I thought it might be interesting for some of you (particularly my political science students!) to get a sense of the evidence that is being cited against Research 2000.  For example, here are a couple of points of contention that are being debated.

1. Minor details in the survey data released by Research 2000, such as the trailing digits in some of the cross-tabs, suggest the figures were not produced by a random sampling process but instead were created by other means. For instance, if the results from respondents who were men in a particular category (say, percent men who approved of Obama) ended in an even number, the same would be true for the results for women in that category – they would also end in an even number. This happened far too frequently to occur by chance; as Mark Blumenthal points out, one would have a greater chance of winning the lottery than of seeing this pattern of results in the trailing digits. But does this prove fraud?  Not necessarily – as others point out, it might be a function of how data was stored and retrieved, a data coding error, or some other weird statistical algorithm.

2. Nate Silver in this post suggests that Research 2000 results for its daily tracking poll did not vary as much as they should have with a simple random sampling procedure. Without going into too much detail, the argument here is similar to the idea that if you flip a coin, and keep track of the heads versus tails, you are going to get a 50/50 split on average, but there will be a statistically predictable variation around this average.  Research 2000 results don’t show the expected variation – they show much less.  Again, Silver suggests this indicates the tracking numbers were manipulated. But as Doug Rivers notes, Silver’s assumption that Research 2000 used a simple random sampling procedure is almost surely wrong.  Most polling is done through stratified sampling – that is, the pollster breaks the sample down into subgroups, such as Republicans and Democrats, or men and women, and then randomly samples from each subgroup.  This would have the effect of producing a final poll that would show much less variability around the sampling mean, that is, the Research 2000 daily tracking poll results would vary less than if the polling was done by simple (not stratified) random sampling, as Silver assumes.

These are just a couple of points that are being debated in much greater detail than I suggest here, and by some really smart people. I realize that this sounds like a lot of “inside baseball” that is not of interest to all of you.  However, I urge those who are interested (particularly my students) to click on some of the links I’ve placed here and work through the arguments.  The math is actually very straightforward – the more difficult part, really, is wading through the jargon that commentators use.

These examples serve a larger point, however, which is why I’ve returned to this topic for a second day.  None of what has been presented so far conclusively proves Research 2000’s guilt or innocence.  The on-going debate, however, is a reminder that there’s a peer-review process at work here, in which those with the expertise to tackle these issues are doing so in a very transparent, albeit somewhat messy, manner. Because of the wonders of the internets, you can actually track the debate virtually in real time. It’s a fascinating process to watch, not least because of the interaction of established statisticians with up-and-coming grad students hoping to make a name for themselves. There’s lots of give and take, some of it acrimonious, but most of it refreshingly free of personal animosity (albeit nerdy to the extreme.)

And it’s a reminder why I enjoy writing this blog – I get to piggyback on the work of a bunch of people who are smarter than me and bring you the results in ways that are, I hope, relevant to the news you read about – like polling results.

I expect that because of this debate over Research 2000’s methods, polling will be both more transparent and more credible – at least that’s the hope.  So come November, when I roll out my pre-midterm election forecasts based in part on polling data, you’ll have some confidence that there really is a peer-reviewed science at work on which I’m basing my arguments, and that I’m not just making it up as I go along.


What Markos Could Learn from Ronald Reagan

I  want to comment briefly on the recent dustup in the blogging and polling world caused by DailyKos founder Markos Moulitsas’ accusation that “the weekly Research 2000 State of the Nation poll we ran the past year and a half was likely bunk.”  Markos links to an independent analysis he sponsored that points to anomalies in the Research 2000 survey results and strongly suggests the results had to be manipulated.  He goes on to say, “I hereby renounce any post we’ve written based exclusively on Research 2000 polling.”

Research 2000 had been hired by Kos more than a year ago to provide polling in races that weren’t often surveyed by mainstream pollsters, and to provide national tracking results as well.  Some websites, like RealClearPolitics initially avoided using Research 2000 results presumably because they feared the results would be driven by DailyKos’ ideological leanings. Others, like TalkingPointsMemo and fivethirtyeight.com incorporated Research 2000 results into their composite tracking polls and other analyses.  Presumably they will now drop Research 2000 from their websites until these charges are resolved.

I don’t know if Markos’ charges are true.  We will certainly know more after other analysts begin sifting the polling results and the independent analysis.  In any case, this is clearly going to result in lawsuits on both sides.  Markos is going to charge Research 2000 with fraud, and the polling firm will likely countersue for libel.

Mark Blumenthal here and Charles Franklin here have good discussions of the controversy from a polling perspective. For my purposes, however, there is a broader point to be made – one that I’ve argued before when discussing opinionated blogging sites such as Markos’ DailyKos.  Because they have such a strong world view, these are wonderful sites to visit when you need to commune with like-minded people.  But you shouldn’t go there for objective analysis! They are churches that nurture the soul – they are not intended to give you an unvarnished take on the political world.

The problem on these sites becomes separating out spin, or opinion, from fact-based analysis.  I don’t mind the opinion – it is often provocative and entertaining. But the Research 2000 polling results were presented as fact, not opinion.  In acknowledging that the surveys that figured prominently on the DailyKos website for almost two years were possibly fraudulent, Markos’ defends himself by noting, “I want to feel stupid for being defrauded, but fact is Research 2000 had a good reputation in political circles.”  He then lists some of Research 2000 clients.

This is a weak defense. The reality is that it was quite clear to anyone who had an open mind that Research 2000 survey results of individual races were often off the mark in a particular direction, and that their national tracking polls consistently showed higher approval ratings for Obama than did other polls.  But there was no indication that this bothered anyone at the DailyKos website, because the results typically slanted toward what they wanted to believe!  Now they are shocked – shocked! – that Research 2000 might have been skewing the polling results.

In looking over their results during the last year, I did not have access to the internal sampling data on which Research 2000 based its analyses. But it became clear to me, when I compared its results to multiple others polls, that they were often outliers in one direction and after a while I simply discounted their results.  Consider, for example, the recent Arkansas Democrat primary between Blanche Lincoln and Bill Halter.  Research 2000 posted the last survey there, and they had Halter up 4%.   Here’s what I wrote on this blog on election night: “Finally, one thing to keep in mind when we look at the polling in Arkansas, which shows Lincoln losing to Halter: most of those polls are by Research 2000, a polling firm closely tied to the Daily Kos website which has come out strongly for Halter.  Unfortunately, Research 2000 polls have been very inaccurate, in large part because their voter sample over represents younger voters.”  Later that night, in analyzing returns, I wrote:  “I just took another look at the final Research 2000 Arkansas poll – it had Halter up over Lincoln by 49-45%.  With a 4% margin of error, and the additional bias built into the Research 2000 survey, I think that means Lincoln goes into this with a very slight lead.”

Lincoln, as you know, went on to win comfortably.  And it appears that I may have been too charitable to Research2000, if Kos is to be believed – it wasn’t simply that they oversampled younger voters.

My point here is not to tout my own forecasting skills (anyone remember my Scott Brown-Martha Coakley prediction one week before that special election?)  It is to remind you – particularly my students who frequent websites like Kos, or DailyDish, or Michele Malkin – not to confuse advocacy with analysis.  The great danger of lurking on a site with a uniform perspective is the echo chamber effect; you begin to substitute the prevailing world view for fact-based analysis.

Let me be clear: no analyst is bias free.  But some at least try to discipline their analysis by sticking with the facts and noting when their analysis strays from the data into the realm of conjecture.  Kos and his followers are clear that their views skew Left.  That’s fine. But I think that the strength and uniformity of the DailyKos world view made posters and readers there susceptible to accepting the data manipulation that they now accuse Research2000 of engaging in. They wanted to believe, and Research 2000 fed into those preconceptions.

And that’s my worry about the blogosphere: that students will gravitate to those sites that reinforce their ideological or political predispositions, and accept uncritically what passes for fact-based analysis there.  It is important to maintain a healthy skepticism when entering these sites. Your role model should be Ronald Reagan.

Reagan, in presenting an arms agreement he had negotiated with Russian leader Mikhail Gorbachev, noted that he acted according to this Russian proverb, which he translated as, “Trust but verify.”   Gorbachev responded, “You repeat that at every meeting!”

And with good reason.

I’m not saying you should not visit sites like DailyKos, or their counterparts on the Right. When you do, however, remember Reagan’s “Russian” proverb.  Had Kos done so, he might not have found himself in the current predicament.

Health Care Legislation: Is It Like Social Security and Medicare?

Several more polls have come out indicating that majority of the public continues to oppose the recently passed health care legislation, a further indication that the Obama-led post-passage publicity blitz has not turned public opinion around on this issue.  Instead, it appears that public opposition has solidified at about 52%, with support hovering 5-10% below that, depending on the poll.

Despite the public opposition, supporters of the health care bill have comforted themselves by noting that previous efforts to expand the social welfare safety net, particularly with passage of the Social Security and Medicare programs, also engendered highly divisive debates but that, once enacted, both pieces of legislation developed deep bipartisan support. As John Dingell, a Democrat representative from Michigan who has long advocated for health care reform told a radio audience: “But remember, the same charges were made by the same people about Social Security and Medicare, and those have worked out to be two of the great and most popular social programs in the history of the country or anywhere else.”

The problem with this argument is that the historical analogies aren’t quite appropriate.

To begin, although debate on both Social Security legislation in 1935 and on Medicare in 1964-65 was heated, in the end both pieces of legislation passed quickly and with bipartisan congressional support. According to the Social Security website, “The Ways & Means Committee Report on the Social Security Act was introduced in the House on April 4, 1935 and debate began on April 11th. After several days of debate, the bill was passed in the House on April 19, 1935 by a vote of 372 yeas, 33 nays, 2 present, and 25 not voting. (This vote took place immediately followed a vote to recommit the bill to the Committee, which failed on a vote of Yea: 149; Nay: 253; Present: 1; and Not Voting: 29.)

The bill was reported out by the Senate Finance Committee on May 13, 1935 and introduced in the Senate on June 12th. The debate lasted until June 19th, when the Social Security Act was passed by a vote of 77 yeas, 6 nays, and 12 not voting.”  In the House 88 Republicans supported the bill while 15 opposed it – the same number of Democrats in opposition, as it turns out. In the Senate, 16 Republicans supported Social Security while only 5 opposed the bill. The conference bill reconciling the House and Senate versions of the legislation was then passed on a voice vote due to the large bipartisan support.

Moreover, the politics of health care differ from that of social security. In lobbying for the social security legislation, FDR deliberately misrepresented the program as an “insurance” plan; as he described it, workers put in a portion of their earnings into the social security program which they could then retrieve when they retired.  In fact, workers do not get their money back when they retire – the program is instead an intergenerational income transfer plan, whereby today’s workers fund current retirees. (That’s why, with a growing elderly population and dwindling workforce, the program’s current spending rate can’t continue without some modifications of revenue sources and/or eligibility requirements.) Moreover, because the program is funded through a “hidden” payroll tax, people tend not to feel the fiscal pain of contributing as acutely as they would if they paid a separate tax to fund social security.  Because the redistributive impact of the financing is hidden, and because everyone contributes to the program and receives benefits, Social Security has broad and deep support, as George Bush discovered when he tried to alter the funding mechanism in 2005.   It’s not clear to me that health care costs will be so easily disguised, nor that the legislation will be viewed as a middle-class entitlement.

Medicare had similar bipartisan support, passing the Senate by a vote of 70-24 and the House by 307 to 116.  And, as with Social Security, a majority of Republicans in the House supported the bill, by 70-68. In the Senate, opposition among Republicans was stronger, but nonetheless Medicare received 13 Republican votes in favor versus 17 against.

As with Social Security, it is funded by a somewhat hidden payroll tax, and everyone is eligible to access its benefits.

Moreover, according to the Gallup poll, 65% of the public approved of the Medicare legislation in January, 1965.  (I don’t have similar public opinion polling data on Social Security from 1935, and am not sure it even exists.)

I don’t need to remind you that the recently passed health care legislation received nary a Republican vote in favor, and that it has never achieved even 50% support among the public. The following table compares the votes on the three pieces of legislation:

Legislation House Vote Senate Vote Republican Support in House Republican Support in Senate
Social Security 372-33 77-6 81-15 16-5
Medicare 307-116 70-24 70-68 13-17
Health Reform 220-207 (the “fixed” bill) 56-43 0-179 0-40

More problematic, however, is that the politics of health care is likely to differ from that of Social Security or Medicare.  In fact, most Americans currently have health care insurance, and roughly 80% of them are largely satisfied with that coverage.  The worry for supporters, like Dingell, of the health care bill is that Americans will perceive it as imposing costs on them to expand health insurance coverage to an additional 30 million people, some of whom voluntarily choose not to be insured.  Moreover, the costs of health care reform depend in part on “reforming” Medicare – a program with strong public support.  If the public perceives that the price of health insurance means a reduction in Medicare services, or declining participation by hospitals and doctors, opposition to the health care plan will grow.  A similar backlash could develop when taxes on so-called “Cadillac” health insurance plans are levied to fund the health care reform program.

For all these reasons, I think that efforts to compare health care with Medicare or Social Security are not very useful historical analogies – their politics and substantive components are very different.

Instead, when we think about the possibility of repealing health care, the historical analogy that may be a better – although by no means perfect – fit is welfare reform.  In 1996, the Republican-controlled Congress passed and Democrat President Bill Clinton signed into law a bill that replaced the decades-old Aid to Families with Dependent Children (AFDC) program with a new block grant program to the states that imposed work requirements on aid recipients and made major cuts to food stamps and assistance to legal immigrants. The legislation was bitterly opposed by liberals who saw it a racially-tinged attack on the poor, but Clinton, after long internal debate, ultimately supported the welfare reform bill.  He did so in part because of Republican threats to pass a more draconian bill, but also because of public opposition to the AFDC welfare program and because the cost of the program (although actually quite small compared to Social Security or Medicare) was viewed as unacceptable in an era of budget deficits.  (Incidentally, most policy specialists now view welfare reform as largely an effective program).

To be sure, this analogy has its own flaws: health care is likely to be much more costly than welfare reform but it is also possible – if the CBO projections hold – that it will not adversely impact the deficit.  And it’s not clear to me that health insurance is viewed in the same way by the public as “welfare” – for many people, health insurance is a fundamental entitlement in a modern industrialized society, whereas “welfare” continues to be viewed by some as a government “handout” to the “undeserving” poor.

Whether health care legislation faces a fate similar to the AFDC program, I think, will depend on several factors:  its budgetary implications, the impact on Medicare, the degree to which the general public views the program as primarily benefiting a “less deserving” subset of the population as opposed to a middle-class entitlement, and whether Republicans – if they regain congressional majorities – can craft a more palatable alternative health reform proposal.  If so, we may see an effort to “mend” health care legislation, rather than to “end” it.