Category Archives: Polling

Does Boehner Have the Votes? A Look at the Holdouts

With last-minute news reports suggesting that Speaker Boehner does not yet have the votes to pass his deficit reduction bill in the House, I thought it might be worth looking more closely at who the potential Republican “no” votes are.  Assuming the House leadership gets no Democratic support, Boehner cannot afford to lose more than 23 Republicans. According to the Hill, there are already 25 “no” or “leaning no” votes, which may explain why Boehner is apparently pushing the vote back until later this evening.

Who are the “no” votes?  Here’s a chart, courtesy of Anna Esten, based on the Hill’s latest whip count, summarizing some district and voting related facts for 22 of the declared “no” votes.  I’ve arrayed hem in ascending order based on the percentage of the vote Barack Obama received in their district in 2008.


Representative District %vote %district vote Obama in 2008 Voting Ideology Rank
Graves, Tom GA-9

100

24

4th most conservative
Chaffetz, Jason UT-3

87

29

52nd most conservative
Huelskamp, Tim KS-1

73.8

30

56th most conservative
Gohmert, Louie TX-1

90

31

116th most conservatve
Gingrey, Phil GA-11

100

33

62nd most conservative
Paul, Ron TX-14

76

33

216th most conservative
Duncan, Jeff SC-3

63

34

7th most conservative
Broun, Paul GA-10

67

38

24th most conservative
Flake, Jeff AZ-6

67

38

33rd most conservative
Gowdy, Trey SC-4

64

38

2ndmost conservative
Jordan, Jim OH-4

72

38

1st most conservative
Harris, Andy MD-1

54.6

40

191st most conservative
Mack, Connie FL-14

69

42

38th most conservative
Akin, Todd MO-2

67.9

44

76th most conservative
Gosar, Paul AZ-1

50

44

124th most conservative
King, Steve IA-5

66

44

221st most conservative
Bachmann, Michele MN-6

52.5

45

89th most conservative
Mulvaney, Mick SC-5

55

45

40th most conservative
Southerland, Steve FL-2

54

45

30th most conservative
Ross, Dennis FL-12

48

48

19th most conservative
Amash, Justin MI-3

59.7

49

139th most conservative
Walsh, Joe IL-8

49

57

74th most conservative


Two factors stand out.  All of them, except for Joe Walsh, come from districts in which Obama received less than 50% of the vote in 2008.  And 16 of them come from “safe” districts, defined as having won more than 55% of the vote in 2010. Eleven of them are members of the House Tea Party caucus. Eleven are also within the most conservative quartile of the Republican caucus.

In short, this means most of them are largely immune to political pressure, and few have any incentive to support a bill that doesn’t address their core concerns, which for most of them is a significant reduction in spending paired with a balanced budget amendment. Moreover, many of them are opposed to Boehner’s plan to appoint a bipartisan congressional committee to suggest further deficit reduction measures, for fear they may come back with a plan that includes tax hikes. To mollify this group, Boehner is promising a separate vote on a balanced budget amendment, but this may not go far enough.

If Boehner is to pull this off, he’s going to need to persuade them that they are more likely to get the cuts they want if they stick with the House leadership now, and put the Senate’s feet to the fire.  However, if the House measure doesn’t pass, and the Senate simply passes a version of the Reid bill and sends it to the House, the House could still attach a balanced budget amendment to the revised bill and send it back to the Senate, with very little time for the Senate to act before the August 2 deadline.  So many Tea Party activists may be waiting for that scenario, instead of signing on to the Boehner bill.

Can Boehner get his bill through the House?  Keep in mind that in addition to these no and leaning no votes, there are at least another 10 Representatives who are undecided.  Boehner needs to hold all of them. Expect Boehner to open the legislative coffers in the next two hours.  Let the bidding begin!

I’ll be on later tonight with updates.

Are Landline-Only Pollsters Systematically Understating Democratic Support?

With less than two weeks remaining before the midterm election, polls continue to indicate that Republicans will make major gains in both the House and Senate.  That has led some Democrat supporters (and others as well) to wonder whether the polls might be overstating Republican support.  One potential source of error is a failure by pollsters to adequately account for cell phone only (CPO) households.  A recent study released by Pew indicates that the CPO households have a distinct partisan bias; as the following table shows, landline-only surveys of likely voters tend to lean Republican by roughly 5% over surveys that include cell phones and landline households.

This has led some people to suggest that polls are overstating Republican support, particularly since some of the most prolific pollsters, such as Rasmussen, rely on automated survey methods that do not survey CPO households at all.  (This is because of restrictions imposed under federal law that prohibit automatic dialing of cell phone numbers.  By automated surveys, I mean surveys conducted by automated voice, rather than a real person conducting the interview.)

While the Democrat bias in CPO households is certainly very real, I don’t think Democrats should pin their hopes on the belief that surveys are systematically understating Democrat support. To begin, pollsters are very much aware of the  CPO problem.  Many major pollsters, such as Gallup, already include CPO households in their sample.  But even those polling outfits such as Rasmussen who do not sample CPO may nonetheless provide accurate survey results.   Consider a Pew study that compared the results of landline only with landline and CPO surveys conducted during the 2008 presidential race.  As the following Pew chart shows (source here), the average error in the landline-only polls was no larger than those that included CPO in their surveys. Although the mean error in landline surveys slightly favored McCain, the difference in errors between combined CPO-landline surveys and landline-only surveys is statistically indistinguishable.

How can this be? The answer lies in how well pollsters conducting landline-only surveys weight their sample demographically.  Simply put, as long as the pollster compensates by choosing landline voters who share the same demographic variables associated with CPO households that have similar political views, landline-only surveys will not be biased.  That is, a properly weighted survey that relies on landline-only households will provide the same results as a survey that includes CPO households.  What are these demographic variables?  They may include income, marriage status,  whether the respondents have children, or education, to name the most prominent.

Of course, with fully 25% of American households CPO, the process of weighting becomes a more difficult task than it was even two years ago.  To achieve the proper weighting pollsters relying on landline-only surveys have to choose the right democraphic weights and they may be forced to over sample from some demographic subgroups in order to achieve a statistically significant subsample.  This oversampling costs extra money, and some companies may be tempted to take shortcuts to avoid spending the money to oversample from the requisite groups.  We won’t know until after the election whether and to what degree landline surveys understate Democratic support.  But keep in mind that many of the most prominent pollsters, such as Gallup, are already including CPO’s households in their survey.

The bottom line?  I think it is highly unlikely that there is an across-the-board systemic bias in the polling so far that is understating the level of support for Democrat candidates for Congress, even among automated pollsters such as Rasmussen.  Democrats are in trouble, and it’s not because pollsters aren’t sampling CPO-only households.

Can We Trust the Gallup Generic Ballot Results?

At this stage in the electoral cycle, the fundamentals that drive the midterm vote – unemployment, real disposable income, attitudes toward Obama – are for the most part fixed, barring a major event. The key question now becomes who will show up at the polls?  As the latest Gallup generic ballot results indicate, turnout is the key to whether on Nov. 2 Democrats lose an average number of seats for the post-World War II era – say about 30 – but retain control of the House, or lose 40 seats or more and are swept out of power in a tidal wave of voter anger.

Let’s look at the latest generic ballot results from Gallup.

If we look only at the generic ballot results of registered voters, we see Republicans ahead by 5%.  That translates into a projected Republican gain of perhaps 40-45 seats (depending on the forecast model), enough to regain the House if everything goes right.  But now look at the results of a survey of likely voters, as opposed to registered voters.  Assuming 40% turnout, which is about par for the course for midterm elections in the post-World War II era, Republicans have a whopping 17% lead on the generic ballot.  That translates into a wave election come Nov. 2, with Republicans picking up 65 or more seats, according to some forecast models. This would be a stunning repudiation of Democratic control of Congress. (Note that Gallup estimates whether one is a “likely voter” based on answers to seven questions that have proved reliable predictors in the past.) If Gallup’s likely voter numbers are correct, it’s 1994 all over again – or worse – for Democrats.  The question is: can we believe Gallup’s numbers? Alan Abramowitz, for one, does not. To begin, Abramowitz believes Gallup’s proportion of Republican to Democrats (55% to 40%, including leaners) in their likely voter, low turnout model, overstates likely Republican turnout. He is equally critical of the predicted proportion of turnout among those age 65 or older (27%) and the proportion of young voters under age 30 (only 7%).  He also questions Gallup’s results for nonwhites: “Among nonwhites other than blacks, a group that comprises about 13% of likely voters, a generic Republican is leading a generic Democrat by 10 points, 52% to 42%. That’s a group that voted Democratic by a 2-1 margin in the 2006 midterm election. Moreover, it’s a group that has never given a majority of its vote to Republican candidates for Congress in any election since the advent of exit polling. According to the 2006 exit poll results, about two-thirds of these “other nonwhite” voters are Latinos. How plausible is it that at a time when the Republican Party is closely associated with stridently anti-immigrant policies that Latino voters are moving in droves toward Republican candidates? Not plausible at all… .”

Abramowitz implies that the only value of putting out these numbers is to change the campaign narrative and, presumably, dampen Democratic turnout – a serious charge.  In his words: “But what is the value of putting out results that defy logic but which can influence perceptions of the current electoral climate among political elites as well as the public?”

What are we to make of Abramowitz’ criticisms?  To begin, Gallup is not suggesting Latinos are moving in droves to Republicans – only that turnout will be heavier among Republican-leaning voters.  More generally, note that political scientists (including myself) are an inherently conservative lot – we tend to believe that future events will unfold largely as past events did.  When they don’t – and 1994 is a case in point – we tend to get caught flat-footed.  No political scientist that I know of predicted the Republican sweep in 1994.  In this vein, Abramowitz discounts Gallup’s results because they are inconsistent with turnout among subgroups in previous elections.  But what if this election is in fact a “wave” election, in which turnout disproportionately favors one group?  Gallup, relying on its likely voter model, is suggesting precisely that – the enthusiasm gap between Republican and Democrats is going to skew turnout in ways that will produce unusual voting patterns.

Note also that the margin of error for Gallup’s results increases when we focus on subgroups within the sample.  If we keep this in mind, Gallup’s likely voter model for subgroups – while historically unusual – is not as outlandish as Abramowitz suggests.  For example, the demographic profile of the 2010 electorate as posited by Gallup is not much different from previous midterm profiles; it is slightly less white, slightly older and slightly more educated than a comparable profile of the 1994 electorate which was the last “wave” election.  The proportion of Republicans, Democrats, and Independents in the 2010 survey is almost identical to 1994’s partisan breakdown.  The big difference is that Gallup sees today’s likely voters as more conservative than in 1994 (54-40%) but also – and Abramowitz doesn’t mention this – more liberal than in 1994 (18% to 12%).  In other words, the big difference between 1994 and today is a drop in the number of likely voters who call themselves “moderates” from 48% to only 27%.

I understand Abramowitz’s concern with Gallup’s number.  But I do not believe they “defy logic” – in fact, they are plausible if we are on the brink of another wave election in which turnout is disproportionately greater among older, better educated and conservative voters (Tea Party anyone?), even accounting for the growth of nonwhites in the electorate as a whole since 1994.  Gallup’s likely voter model could be wrong.  But we need to be careful about jettisoning a methodology that has proved reliable in the past just because this time around it is provided results that seem historically atypical (or because we don’t like the outcome!)

A final thought. Gallup’s generic ballot numbers have been stable for three weeks, but that does not mean they can’t change in the remaining two weeks. Gallup estimates that there is still a block of voters – about 5% – who remain undecided. If we look at previous midterm election cycles dating back to 1994, there have been instances in which the results changed considerably in the last two weeks.  For example, in 2002, Republicans were trailing the Democrats in the Oct. 20 generic ballot results by 3%, but in the final poll they led by 6%, a net pick up of 9% points. They ended up gaining 6 seats in the House that fall.  In 2006, Democrats’ lead in the poll dropped 6%, from 13% to 7%, in the same time period, but they still gained 30 House seats.

In the end, it’s going to come down to turnout.  If Gallup’s likely voter numbers hold, it will be 1994 all over again.

The Midterm Elections: A Choice, or a Referendum?

Two weeks ago Democrats’ hopes for the midterm elections were briefly raised when the Gallup generic ballot came back showing a dead heat, 46%-46%, in voters’ preferences between the two parties. Some progressive media sites, buoyed by the poll, wondered why it did not receive more press coverage.  Alas for Democrats, the most recent Gallup survey puts Republicans back up by 5%, 48%-43%, a margin that is identical to the average lead held by Republicans in the Gallup poll since the start of August.  I’ve written before about the need to view one-time fluctuations in the generic ballot results with caution, and the latest results are a reminder that, despite these fluctuations, for the most part Republicans have lead in the generic ballot for almost two months.  This is important, because as I’ve also discussed in previous posts, the generic ballot results are a useful, if not infallible, tool for predicting the actual midterm results.  As I noted in my previous post, several of the midterm forecast models developed by political scientists incorporate the generic results, and these are the ones that suggest Republicans are poised to gain upwards of 50 seats in the House come November.

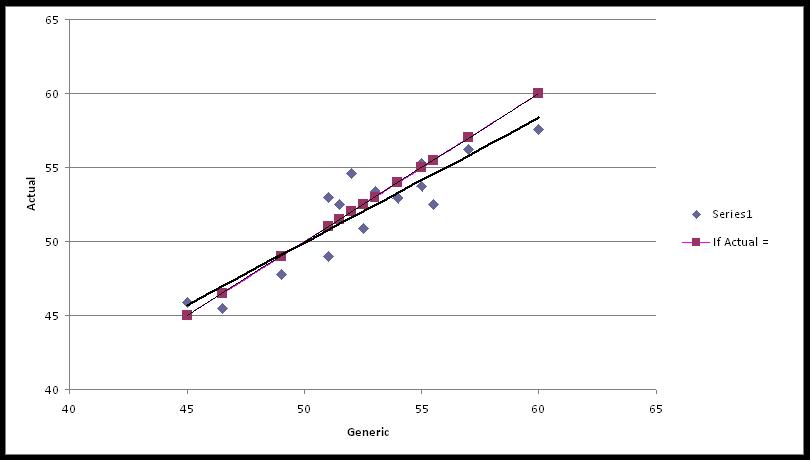
To get a sense of the significance of the generic ballot, I had my research assistant Matt D’Auria plot the final Gallup generic ballots results (the x-axis) against the actual aggregate popular vote (the y-axis) received by the Democrat Party in each midterm election dating back to 1952.  For comparison purposes, he also plotted the results as if the generic result perfectly predicted the actual aggregate support for the Democrats (the red line).

By fitting a regression line to the actual data, we can construct a simple equation that estimates the final popular Democrat vote based on the generic ballot results. If we plug in 43%, which is what Democrats are currently receiving on average in the generic survey, the regression suggests that Democrats will receive 44% of the actual aggregate popular vote in November. That’s actually better than one might expect, given that in most years the actual vote falls below the generic results. (Warning: this is a crude estimate, particularly since the current level of Democrat support is lower than that in any of the previous years’ totals included in our sample.)

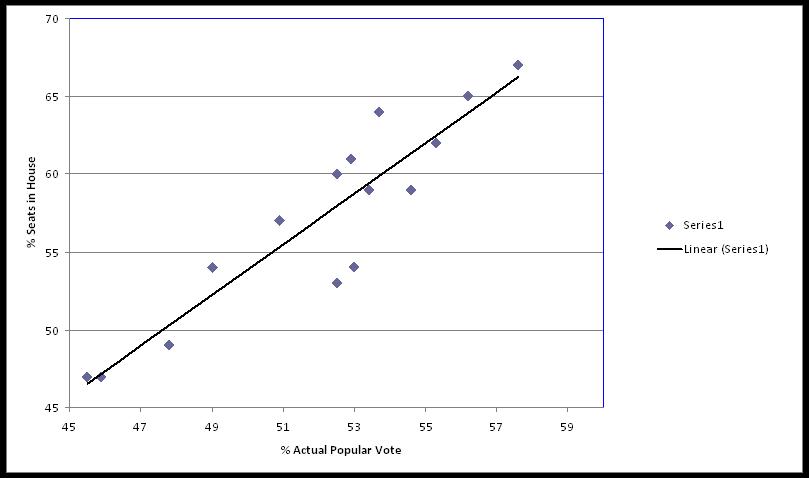
However, what we really want to know is how many seats the Democrats are likely to win, assuming – as our crude model does – that they receive 44% of the aggregate popular vote. If we plot previous aggregate support against actual seats won, we can again estimate a very simple regression equation, keeping in mind all the caveats mentioned above.

Plugging in our predicted value of 44% popular support for Democrats, our crude model indicates that Democrats will win about 44% of the 435 House seats, or only 191 seats come November – a projected loss of 65 seats!

Now before my Democrat readers slit their tree-hugging wrists, keep in mind that these are very squishy estimates; there’s a large margin of error around this projection.  None of the more sophisticated forecast models of which I am aware forecast Democrats losing 65 seats.  And with a month and half to go before the midterms, the generic ballots results can still change.  Moreover, the simple model I’ve presented here encompasses a long time period during which the underlying dynamics of congressional elections has evolved. However, these long-term changes don’t necessarily help Democrats. Most importantly, as I’ve indicated in previous posts, congressional elections – including midterms – have been increasingly nationalized in recent years.  That is, individual races are more susceptible to broader forces affecting the nation as a whole.  And right now, those broader forces – most notably the lagging economy and ambivalence toward the Obama presidency – are working against Democrats.

This is all a long way of saying that the recent Delaware Senate primary results are, in my view, consistent with a broader picture, one that does not bode well for Democrats in the coming midterm elections. They may not lose 65 seats, but if history repeats, they are likely to lose closer to 40, and their majority, than to 25 which is the post-World War II average.

Is there any way to prevent his from happening?  If I am an individual Democrat in the House from a marginal district (one in which I won with less than 55% of the popular vote) and am running for reelection in this climate, I would fall back on those tactics that traditionally work for incumbents: emphasizing constituency service and name recognition, reminding voters about what Republicans stand for, and distancing myself from the President and his policies.  The goal is to make this election a choice – not a referendum on the party in power.

Predictions, Predictions: Congress and the Courts

How reliable is the generic ballot survey question in helping forecast the size of the Democratic losses that will occur in November?  As we move closer to November 2, a growing proportion of my blog posts will undoubtedly focus on the midterm elections.    Many of these posts will likely mention the generic ballot question that is asked by a number of polling firms.  As most of you know, this question typically take some version of the following form: “Looking ahead to the Congressional elections in November, which party do you plan to vote for if the election were being held today?”  The survey results, as many of you have heard me say, are actually a useful indicator of the likely outcome of the November midterm election.

But how useful? In a recent blog post, Nate Silver at fivethirtyeight.com raised important questions about the utility of the generic ballot question results. Silver writes: “It might be the case that the generic ballot is fairly stable, but that doesn’t necessarily mean it’s all that useful an indicator. In addition to the fact that the consensus of polls (however careful we are about calibrating it) might be off in one or the other direction, there’s also the fact that the thing which the generic ballot is ostensibly trying to predict — the national House popular vote — is relatively irrelevant to the disposition of the chamber, or the number of seats that each party earns.”

Political scientist Alan Abramowitz, (via Brendan Nyhan) takes issue with Silver’s comments, calling portions of them “pretty silly.”  I wouldn’t characterize Silver’s comments as silly, but I certainly disagree with portions of his post, particularly his claim that the national House popular vote is “relatively irrelevant to the …number of seats each party earns.”  Although it is not a perfectly precise indicator of how many seats a particular party will win (or lose) come November, it does provide a useful approximation.  Similarly, the generic ballot question does help us predict, within a margin of error, what the likely popular vote will be come November. To be sure, in some midterms it has proved more useful than others.  But it is not irrelevant.

The bottom line, then, is that the generic ballot results, properly understood, helps us predict the November midterm results. To see why, it helps to understand how political scientists factor the results of this question into their midterm forecast model.

When a generic ballot survey comes back with results showing, as the most recent Gallup survey poll does, that Republicans are favored over Democrats by 7%,  50%-43%, that doesn’t necessarily mean Republicans will win 7% more congressional seats.

Indeed, as Silver correctly points out, the generic ballot result can’t even tell us how many overall votes each party will get in the midterm, never mind how they will do in each of the 435 districts.  But political scientists understand this.  As it turns out, they don’t necessarily have to perform a district-by-district level analysis to get a decent handle on the total number of seats each party will win.  Instead political scientists can use the generic ballot results as one factor in statistical models that also take into account the existing political context as well as “structural” attributes associated with a midterm election.  So, for example, Abramowitz’s midterm forecast model uses only four variables to predict the midterm outcome, as measured by seats lost/gained:  the results of the generic ballot question, presidential popularity (as measured by the Gallup poll), the number of seats held by Republicans going into the midterm election, and a simple indicator variable that signals this is a midterm election, rather than a presidential one.  (This last variable is important because the president’s party typically loses seats in the midterm election.)

How do we know that the Abramowitz model (or others like it) is reliable?  Because it is constructed using previous midterm election results.  In effect, by looking at previous midterms, Abramowitz can build an overall “generic” statistical model that says, on average, how important each of these four variables is in determining the midterm election results.  Then, by plugging the current values for each variable into the existing model, he comes up with a forecast.  Political scientists have constructed different forecast models, but they typically all include some mix of variables that measure voters’ partisan sentiment, structural attributes associated with the midterm, and some indicator of the environment (political and otherwise) in which the election is being held.

Now, these models aren’t completely foolproof.   They are predicated on the assumption that the factors influencing the current midterm will behave pretty much as they have in the past. Say something unexpected happens – terrorists attack the World Trade Center, for example.  That may unexpectedly distort the relative importance of some variables, thus throwing the forecasts slightly off.  Moreover, even without unexpected events, there is always some uncertainty involved with these forecasts – some unexplained variance for which the model cannot account.

But it would be wrong to suggest, as Silver does, that the generic ballot question is “irrelevant.”  In fact, it is a highly relevant and useful predictor of the midterm outcome – as long as it is evaluated within an overall understanding of the factors that drive midterm elections.  And right now, it favors the Republicans by 7% – not a good sign for Democrats at all.

I will have much more to say about the generic ballot in the next several posts.  Before doing so, however, there’s another prediction that I need to discuss: Elena Kagan’s Senate confirmation vote to the U.S. Supreme Court.  Long-time readers will recall that in an earlier post I set the over/under for the Kagan no votes at 35.  In a sign that my predictive powers may be slipping (remember that I nailed Sotomayor’s exact confirmation vote) Kagan was confirmed with 37 votes in opposition, so I was two votes off.  (If you must know, it was Nelson and Brown). Will Loubier, on the other hand, hit the final vote margin squarely on the head, thus winning a Presidential Power “It’s the Fundamentals, Stupid!” t-shirt.   Here’s Will, looking justly proud of his prognosticative abilities:

For the envious among you, note that I’ll be giving away another t-shirt in the “predict the midterm outcome” sweepstakes.  Stay tuned!