Category Archives: The Middle

How Do Americans Like Their Policies? In Moderation, Please.

In Monday’s post I took issue with Vox founder Ezra Klein’s claim that, in his words “the idea of the moderate middle is bullsh*t.”  You will recall that Ezra argues that indexes purporting to show the existence of a moderate middle are misleading, because they are often amalgams of ideologically extreme opinions. But we don’t need to rely on indexes as evidence that many Americans have moderate policy views – we can look at their responses to specific survey questions. The American National Election Studies (ANES) researchers have been asking Americans about their opinions on issues for several decades now. Typically the question starts by giving the respondent two policy extremes and then asks her to place herself somewhere on a 7-point scale anchored at either end by the extreme responses. As an example, here is a question asking individuals their views regarding government spending on services: “Some people think the government should provide fewer services, even in areas such as health and education, in order to reduce spending. Other people feel that it is important for the government to provide many more services even if it means an increase in spending. Where would you place yourself on this scale, or haven’t you thought much about this?”

Day Robins tabulated the responses to five of those questions for which we have data across time, including the government spending/services question. In each case the moderate, or middle response (Option 4) is typically the modal response, or close to it, across the entire survey history. (Note: although researchers often group the “don’t know/haven’t thought about it” bottom response with the moderate/middle answer, Day has not done so here. So the charts below likely understate the number of respondents adopting the moderate position.)

Here’s the government spending/services time trend.

gov services.16

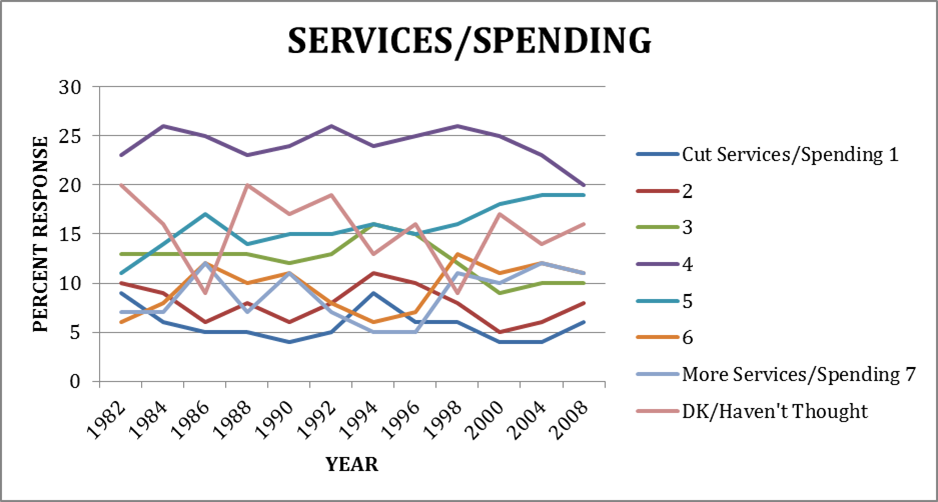
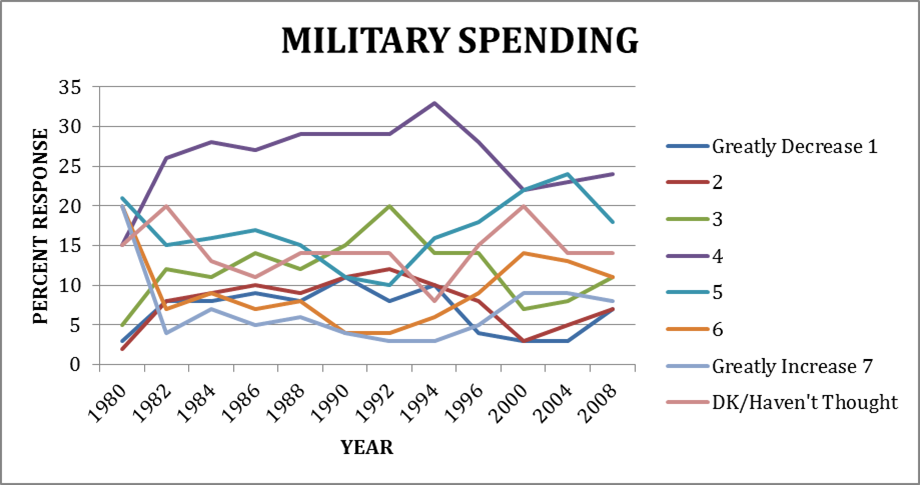
As you can see, even without including the “don’t knows” the most frequent response across a quarter century has been the middle, moderate choice. (The second most frequent response in recent years is 5.) For the most part, we see the same general pattern on the other four questions Day has graphed; the moderate position is typically the modal response. Here’s the graph of responses regarding whether to increase military spending.

military spending.16

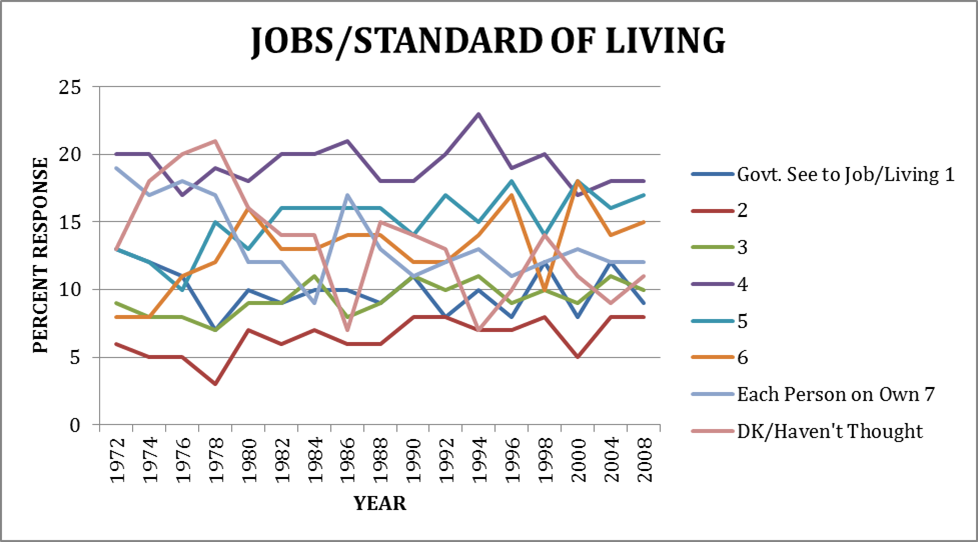
Here’s one asking about government creation of jobs.

jobs.16
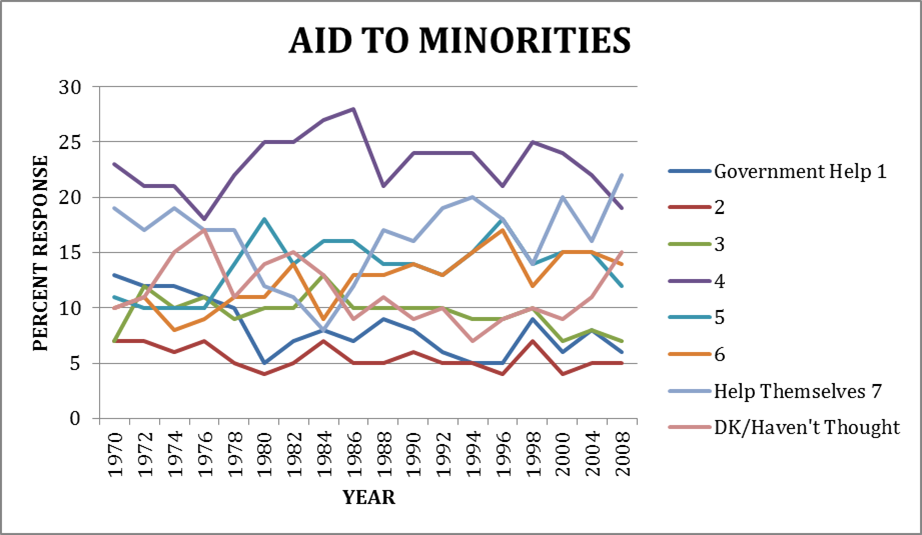
This one addresses aid to minorities. For most of the time period the moderate position holds sway, although in 2008 it is slightly eclipsed by option 7 “Help themselves”.

aid to minorities.16
Finally, here’s one measuring support for government health insurance. Here option 1 – strong support for government health insurance is marginally preferred to the moderate position in the 2008 survey. But note that support for the moderate position has actually been increasing, while option 7 – private coverage – has lost support.

health insurance.16
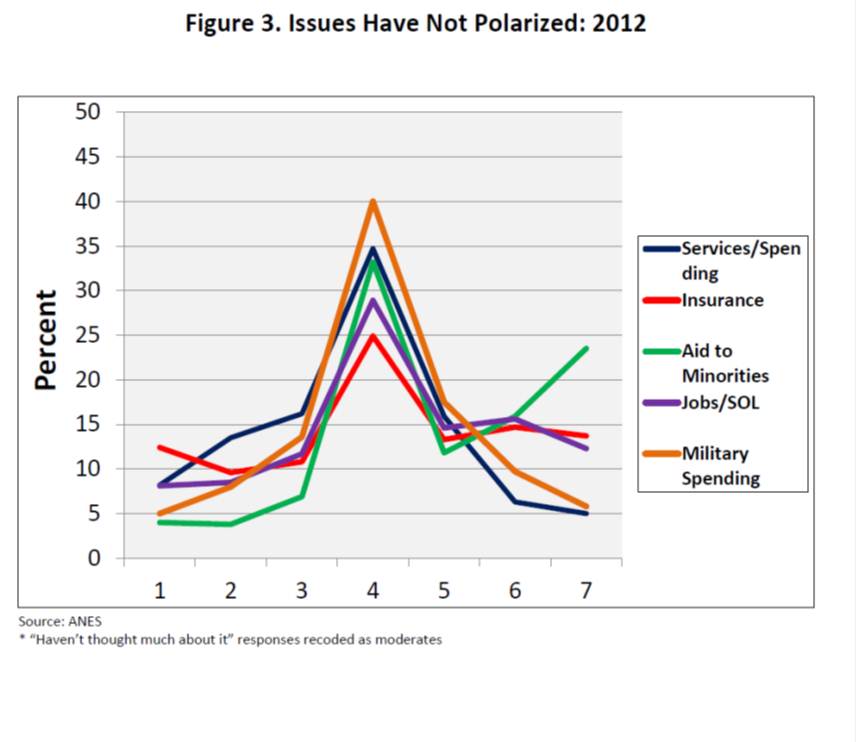
Now, before Max Kagan jumps all over me, these graphs are not evidence that most Americans are moderates across all issue areas. In fact, it is quite possible that their views vary depending on the issue. But the graphs do suggest that for most of the time on each of these issues, a plurality of Americans stake out a moderate position, with the exception of whether the government should provide health insurance and, in 2008, aid to minorities. And this is without including the “don’t knows/haven’t thought about it” response with the moderate answers. If we lump those in, as Abrams and Fiorina do for the 2012 responses to these questions, the moderate views appears even more popular.

Fiorina 3 moderates
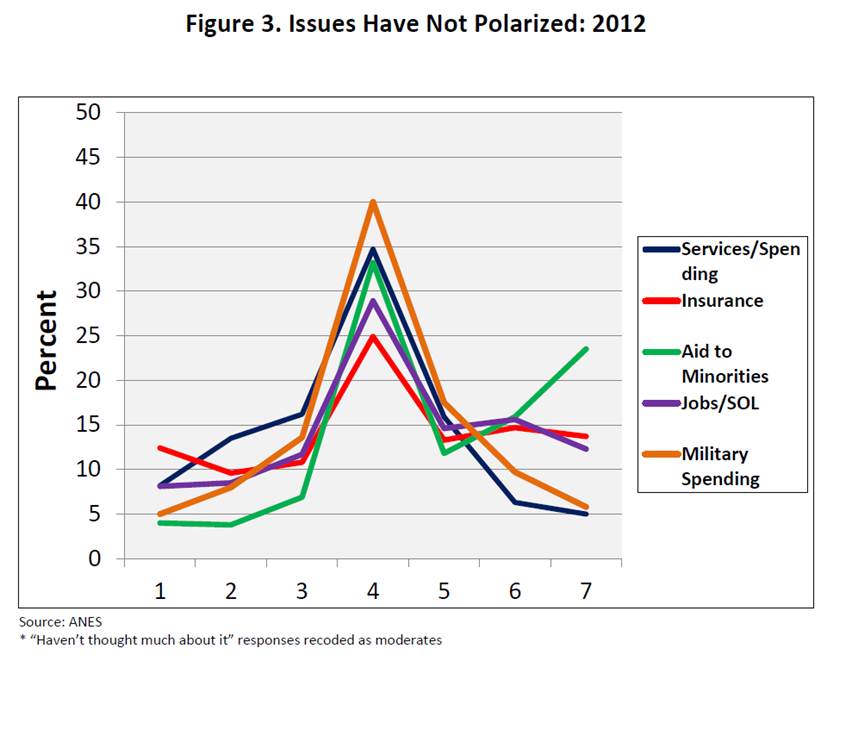
Moreover, on three of these issues across most of the time period  – government services, jobs, and military spending – the responses are normally distributed, with most responses clustered around the center of the ideological spectrum, similar to what the Abrams/Fiorina graph shows for 2012. The government health insurance answers skew slightly liberal, and the aid to minorities responses are weighted more to the conservative side of the response distribution.  If Americans were becoming more polarized, we might expect to see a decrease in the number of Americans adopting a centrist position, and increases in those choosing more extreme positions, on these issues.  On the other hand, if what most pundits describe as ideological polarization is really party sorting, then I think we’d be more likely to see the graphs that Day has compiled.

Yes, at the individual level many Americans hold contradictory and sometimes extreme positions. But many hold moderate views too. And, in the aggregate, at least on these five issues, most respondents across much of the last quarter century cluster at or near the middle of the ideological spectrum. Yes there is some movement across responses categories.  But it is hardly enough to lend credence to the notion that the moderate middle is a myth.  And it is consistent with the notion that there has been no significant growth in ideological polarization.

The Myth of the Myth of the Moderate Middle

Vox founder Ezra Klein posted this diatribe last week explaining why he believes “moderate voters are a myth” that was extreme even by Ezra’s standards. Drawing on this draft paper by Douglas Ahler and David Broockman, Klein argues that the notion of moderate voters is a statistical artifact that occurs when researchers aggregate responses to several survey questions into a single ideological scale. So, greatly simplified, the idea is that if an individual gives a very conservative answer to one question, and a very liberal one to another, the “index” based on these responses might classify her as a “moderate” by, in effect, balancing the two extreme responses. But in fact all the survey responses show is that she has diverse but extreme opinions – not moderate ones.

In principle, Klein’s criticism is correct. Indeed, scholars have long been aware of this problem when it comes to creating indexes of ideology. Note, however, that it is not only a problem with indexes that purport to show that voters are mostly moderate – other indexes professing to show that Americans are becoming more polarized also suffer from similar coding issues. (In this vein, see this Fiorina, Abrams and Pope’s critique of this Abramowitz/Saunders article on ideological realignment in the United States. Their essential point is that slight movement in responses to one question can, depending on coding, make it appear that voters are changing positions from moderate to extreme on an ideological index .)

Had Ezra stopped there with a caution to be careful about interpreting indexes that purport to measure ideology, I would have been happy. But he doesn’t.  Instead, Ezra goes on to dismiss the idea of a moderate middle entirely: “The deeper point here is that the idea of the moderate middle is bullsh*t: it’s a rhetorical device meant to marginalize some policy positions at the expense of others. There’s no actual way to measure it, or consistent definition animating it, and it doesn’t spontaneously emerge in any of the data.”

I’ll have more to say about the Ahler/Broockman paper in another post. (By way of preview, I think their findings actually support the notion of a moderate middle.) But the notion that the existence of a moderate middle is “bullsh*t”, to use a scientific term is, well, cow dung. Even if many Americans hold inconsistent views, and thus it is hard to classify them ideologically does not mean that on most issues the preferred position among Americans is an ideologically extreme one. Consider, for example, this analysis by Abrams and Fiorina regarding the distribution of responses from 1 to 7 to five policy questions asked by the American National Election Studies in 2012.  (Typically, the questions lay out two alternative policy positions on an issue, such as whether the government should or should not make an effort to help the social and economic standing of African-Americans, and asks respondents to place themselves on a 7-point scale in terms of where they stand on the issue.  Position 4 is the most moderate one, with 1 and 7 holding down the extremes.)

Fiorina partisan nonchange.emfAs you can see, the modal response to questions asking where the respondent stands is the moderate one on all five issue areas. (Note: the authors code the “don’t know/haven’t thought about it” as a moderate response based in part on comparing responses with other surveys that do not include these response options, and finding little difference in the distributions of responses.) Nor is this unique to 2012. Day Robins went back and looked at responses to these questions through several decades and found that for almost every survey the modal response on these five issues is the middle, or moderate, one.  I’ll show some of this data in graphical form in a separate post.

This is not the same as showing that at the individual level voters are mostly moderate, of course. It could be that different moderate coalitions consisting of different individuals show up on each issue. On the other hand, it doesn’t justify dismissing the idea of a moderate middle either, at least when it comes to choosing policy options in a number of issue areas. As Philip Bump reminds us, we need to be careful when we adopt short-hand language for any concept. But while Klein is right to point out the dangers of creating indexes to measure ideology, when it comes to the American voter I’m not ready to throw out the concept of a moderate middle in its entirety. That would be too extreme.

Independents and Obama: How Polarized is the Public?

In the last several posts I have been presenting evidence indicating that rather than the “post-partisan” presidency promised during his campaign, Obama has in fact proved every bit as polarizing as his immediate predecessors.  With hindsight, some of you are now arguing that there was no reason to expect Obama to be anything but a partisan president, but a careful read of his campaign speeches clearly indicates that he held out hope for a change in the tone of Washington politics, in addition to a change in policy direction.  And, contrary to what many of you are now saying, at the time of his election not a few of you believed he would in fact bring not just a new policy direction, but also a new more civilized mode of political discourse on Capitol Hill.  Indeed, if I heard a variation of the following refrain from colleagues and students once, I heard it 100 times: “I’m really optimistic that Obama’s election will finally end the partisan bickering in Washington.”  Admit it – you were one of those who believed, weren’t you?  (You know who you are!)

Of course, this was never likely to happen, as I quietly tried to suggest in my earlier blog postings and talks during the transition and aftermath of the inauguration.  My goal in harping on this theme is not to cast myself as a latter-day Cassandra. Instead, it is to make three broader teaching points. (After all, that’s the point of this blog!)  First, there was an inherent tension in Obama’s promise to bring policy change AND to lower the degree of partisan bickering on Capitol Hill.  He was unlikely to accomplish both objectives and, in the end, not surprisingly chose partisanship and policy change over bipartisanship. To do otherwise – to pursue a more bipartisan strategy – would have required an enormous expenditure of political capital. Second, the polarized politics that have characterized presidential-congressional relations are not due primarily to the actions of any single president, but instead are largely the result of the confluence of several long-term trends in American politics. By understanding why polarization exists, we are less likely to be disappointed by Obama’s failure to change that tone – it really has little to do with his skills or style of leadership.  Similarly, once we understand the sources of polarization, we are better able to adopt a more realistic assessment of previous presidents’ culpability for the current state of affairs.  Third – and this is one of the main reasons why I write this blog – Obama’s failure to usher in the era of the post-partisan presidency reminds us that presidents possess much less influence than pundits and journalists would have us believe. Ours is not a presidential form of government so much as it is a congressionally-centered system.

Some of you are now arguing that partisanship may be a good thing, or at least less worrisome, as long as policy change occurs.  I will devote a separate post examining this question, in part by looking at the production of legislation under various partisan permutations. But note that partisanship is not without its costs.  Eventually, a polarized debate on Capitol Hill will filter down to the public, and we will see Obama’s popularity approval ratings exhibit the same polarized division that characterized Bush’s support.  Indeed, this is already happening; in the aftermath of congressional passage of the economic stimulus bill followed by the first budget resolution – both of which took place with almost no Republican support – we already see Obama’s popularity exhibiting Bush-like characteristics.  According to Amy Walter at the National Journal the latest Diageo/Hotline poll shows that just 19 percent of Republicans thought more government involvement in the economy is a good idea, compared with 79 percent of Democrats. “Asked if they think the stimulus plan will be successful in turning the economy around, 72 percent of Republicans said no while 86 percent of Democrats said yes” (see article here).

Of course, it may not be surprising that Republicans – only 9% of whom supported Obama in the election – are registering disapproval of Obama in increasing numbers, based in large part on his economic policies, while Democratic support remains high.  But what of the key swing group, the independents? By the end of Bush’s presidency, only about 30% of independents approved of his job as president. Obama won the independent vote in November by 52-44, and so far, his support among this group remains strong. According to the March 30-April 5 Gallup Poll (see table below),  his approval among independents is 60% – almost exactly what it was on inauguration day and pretty much where it has remained ever since.

However, Walter, citing the Diego poll, notes that those independents who said they “strongly” approve of the job Obama is doing dropped 13 points between the end of January and the end of March. She also notes that that independents’ support for Congressional Democrats is softening as well: “From the beginning of March to the end of the month, the approval ratings of congressional Democrats among independent voters dropped 10 points, from 48 percent to 38 percent. Same goes for the generic ballot test. In our most recent poll, independents gave a slight edge to Republicans (26 percent to 23 percent) — a 6-point drop for Democrats since early March.”

As yet, the drop in independents’ support for Democrats has not translated into an increase in their support for Republicans now in Congress. Walters notes that, “Just 26 percent of independents approve of the job Republicans are doing in Congress (a 4-point drop since early March). The 26 percent that Republicans are getting in the generic matchup is unchanged since early March as well.”  We see, then, that among independents, support for Obama is strong, but potentially softening.  However, most of the erosion in independent support seems focused on the Democrats in Congress.  Whether and to what degree that will extend to a loss of support for Obama depends, I believe, in large part on perceptions regarding the economy.  Polarization within the public becomes a major problem, I argue, when it includes a loss of support among independents, and not just Republicans.

So, why does polarization exist? One reason is the efforts by well-meaning reformers to reduce the influence of money on elections. Many of you will recall that in his 2004 run for the Democratic nomination for president, Howard Dean trumpeted the fact that a huge proportion of his campaign contributions came in small amounts, often under $200.  In 2008, Barack Obama picked up on this theme, arguing that he was broadening popular participation in elections by attracting financial support from those who represented the “average”, less wealthy voter, rather than the “fat cats” who typically funded campaigns.  In their view, the internet was “democratizing” presidential campaigns. As my colleague Bert Johnson’s research reveals, however, this is not what was happening – at least not in the way that the Dean-Obama campaigns would have us believe. Their fundraising strategy did not mobilize the less partisan, middle-of-the-road voter.  In fact, it benefitted from – and may actually have contributed to – the increased partisan polarization that characterizes American politics today.  To understand why, and to appreciate some really innovative research, I want to devote the next post to Bert’s research on campaign finance.  He tells a fascinating – and counterintuitive – story that merits a full discussion, and helps illustrate two of Dickinson’s three laws of politics: “Money always finds its way to candidates” and “For every positive benefit from a political reform, there is an equal and unanticipated negative reaction.”

The UnDecideds Decide – But for which candidate?


Three more national polls have come in overnight, from Marist, Reuters/Zogby and IBD/TPP.  Presumably all include some polling from as late as Sunday. None do much to change the scenario in the national popular vote scenario I painted yesterday (Obama up by roughly 5-7%), but it is interesting to see how IBD/TPP allocated its undecideds.  As I noted yesterday, most of the major pollsters, in line with what I had suggested a few days back, are allocating their undecideds roughly 60-40 for McCain.  They do so on the basis of demographics and by “pushing” the undecideds by asking them to make a choice.  Most break for McCain when pushed.  IBD’s final poll has Obama up 47.5%-42.4%, a 5.1% margin.  But they then allocate the undecideds to Obama by a 4-to-1 margin, 4.0-1.9, to give them a final poll result of 51.5-44.3%.  Had they allocated their undecided similarly to the other pollsters (say 3-2 for McCain), the final results would have 49.5%-45.4% – a different race on its face.

This doesn’t count the 4% “Other” that still remain in the IBD poll, which presumably included remaining undecideds.

Marist says it pushed its leaners, but it doesn’t reveal the breakdown. Its final poll has 2% undecided and 3% “Other”.  I have not been able to find a breakdown of Zogby’s undecideds.

I have no idea if IBD’s decision is the correct one. But one of these pollsters is allocating undecideds incorrectly.  We’ll know in less than 24 hours.

Some Data on Undecideds

There’s a nice summary by Charles Franklin at Pollster.com  (see here) of the National Election Studies analyses dating back to 1948 regarding how the undecideds break in presidential elections.  As I noted in an earlier post, the basic rule of thumb is that challengers do slightly better than incumbents, but that doesn’t apply in this election since there’s no incumbent (although Obama would have you believe that McBush is the current officeholder!)  Franklin notes that there’s rarely a lopsided split toward one candidate or the other. The most recent one-sided split occurred in 2000, when about 7 in 10 (66%-23%) of the undecideds broke for Bush over Gore.  But usually the break is closer to 55-45, which is how Pew allocated their votes for McCain and Obama in the poll I cited yesterday, and which is consistent with how leaners break when pushed by pollsters.

The other point Franklin makes is one that Jesse Gubb brought up yesterday: a substantial number of undecideds just don’t vote.  Based on the graph, a rough “guestimate” is that 10-15% of undecideds don’t bother voting. Of course, given the small subsample sizes, there’s a lot of uncertainty in these estimates.  And Franklin doesn’t bother telling how undecideds are defined either – is it voters who have not made up their mind in the last day?  The last week?

What does this suggest for 2008?  As Bert and I have both noted, there’s no clear pattern across elections that seems to explain how undecideds break, except perhaps for a slight partisan effect that Bert picked up in his analysis. Based on the demographics of the undecideds,  and the results in those races that have tightened in recent days (e.g., in Pennsylvania where McCain is winning 5-1 among late deciders), I continue to believe that the majority of the undecideds will go to McCain, but not in great enough proportions to win the election for him.  The exit polls will give us an early indication regarding how those who come to a decision in the last two weeks voted. Interestingly, if you look at the tracking polls so far (and I’ll recheck this data today) the number of undecideds is holding steady at about 6%.  That’s why Pew, in their final poll, had to make a decision to allocate them.

I just want to be clear here: given current polling figures, even if the undecideds break substantially for McCain, it won’t be enough to give him a victory in the popular vote. It may be enough to put him over the top in key battleground states, however.  I’m doing a longer analysis of that now.