Category Archives: Polling

Does Iowa Even Matter? The Latest Polls Results

Will the results of the January 3 Iowa caucus even matter to the outcome of the 2012 Republican presidential nomination? My colleague Bert Johnson and I have discussed this matter here.  Bert’s basic point is that the Iowa caucus helps voters solve what he calls a coordination problem, in which those who share a similar ideology and policy preference must decide which candidate to coalesce behind.  In so doing, they give that candidate “momentum” going into later contests.  Bert’s claim is consistent with conventional wisdom among political scientists which argues that Iowa’s significance lays not so much in who wins the caucus as it does in who loses. Simply put, those who fail to meet expectations drop out of the race, thus helping solve the coordination problem.

While I don’t disagree with the basic logic that says early nomination contests help winnow the field, the historical record indicates that Iowa has not played much if any role in that winnowing process. In looking at previous Iowa caucus results dating back to the start of the modern primary-centered nominating process in 1972 there has been only one year by my admittedly back-of-the-envelope calculation where the results in Iowa have served to directly winnow the field in significant numbers. As the table below indicates, that would be the Democratic contest in 2008, which eliminated three candidates of the six Democrats actively campaigning there: senators Joe Biden and Chris Dodd, and Governor Bill Richardson. (Note: I only included candidates who received 1% or more support in the Iowa caucuses.)

Year #Democratic Candidates # Who Withdraw After Iowa # Republican        Candidates # Who Withdraw After Iowa
1972 6 0 No Republican contest
1976 6 0 2 0
1980 2 0 7 0
1984 7 0 1(Reagan Unopposed)
1988 4 0 6 1
1992 5 0 1 (G. H. W. Bush Not Challenged in Iowa) 0
1996 1 ( B. Clinton Unopposed) 8 0
2000 2 0 6 1
2004 5 1 1 (G. W. Bush Unopposed)
2008 6 3 7 0

In most years, however, the Iowa results do not seem to precipitate a significant number of withdrawals. Indeed, in 15 contested caucuses since 1972 involving 80 candidate-races, only six candidates dropped out as a result of doing poorly in Iowa.

Now, this may underestimate Iowa’s actual impact on the nominating process. To begin, I don’t count those candidates, like Tim Pawlenty this year, who drop out before the caucuses are held because they perceive a lack of support in Iowa.  Moreover, candidates who exceed expectations in Iowa may receive a boost in support down the road, and those who fail to clear the expectation bar may see their subsequent support decline.  But strictly speaking, the vote in the Iowa caucuses rarely culls the candidate herd in large numbers by itself. Indeed, in most years it has no impact on the size of the field whatsoever.

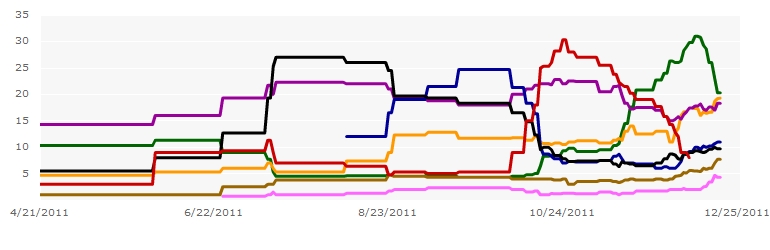
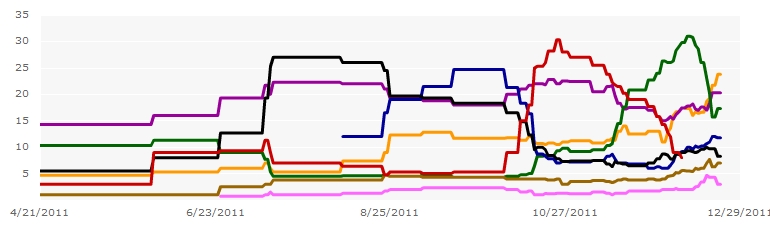
So, what does this suggest come January 3?  Two more Iowa polls came in during the last two days.  This Rasmussen poll has Romney leading the field with 25%, followed by Paul at 20% and Gingrich at 17%.  A second poll commissioned by Iowa St. has Paul as the first choice of 27.5% of those surveyed, followed by Gingrich at 25.3% and then Romney at 17.5%.   Of greater relevance to this post, however, both polls showed Bachmann and Santorum trailing the field among active candidates.  (Perry is 4rth in both.)  These results are consistent with the latest RealClear Politics composite poll, which shows only Bachmann, at 8.3%, and Santorum, at 7% as polling in single digits in Iowa. (Santorum is black and Bachmann brown in the graph below. Huntsman, in pink-purple at the bottom, is not actively campaigning in Iowa.)

Assuming they finish as the bottom two in Iowa, will either Bachmann or Santorum drop out?  With the New Hampshire primary one week later, on January 10, my guess is both may stay in to see whether social conservatives will decided to coalesce behind one or the other of them, thus giving that candidate a boost heading into South Carolina. Unfortunately, New Hampshire is not a particularly hospitable climate for their brand of political conservatism, which means one or both might decide to continue even if they do poorly in New Hampshire.  All this assumes, of course, that they have enough money to do so.

Make no mistake about it. The Iowa caucus will be a huge media event. It is less likely, however, that it will be a significant political event that helps to winnow the field.  Indeed, if history is a reliable guide, at least six and possibly all seven Republican candidates now in the race are likely to be still in the contest after Iowa.  Is Iowa relevant? Yes. Decisive?  Probably not.

The Perils of Polling Paul: Are the Iowa Results Correct?

Can Ron Paul win Iowa?  Shortly after posting my assessment of this PPP Iowa poll yesterday that showed Ron Paul leading in Iowa, Insider Advantage released a second Iowa poll that also showed Paul ahead in Iowa with 24% support.  As in the PPP poll, Romney was second (18%), but Gingrich had dropped to 4th in the IA poll at 13%, behind Rick Perry’s 15.5%.  The two polls immediately fueled debate regarding whether Paul could win in Iowa. Without discounting that possibility, I want to inject a note of caution regarding the mini-Paul media boomlet that we will undoubtedly experience in the next two days.

The major issue is whether these two polls are inflating Paul’s support.  I have noted on previous occasions how difficult it is to develop an accurate sample of likely voters in a caucus state.  Keep in mind that turnout in Iowa will likely be about 100,000 voters – not a huge number by any means in a state with over 2 million registered voters, including more than 600,000 Republicans.  Trying to anticipate who will actually turn out on Jan. 3 is as much art as science.

Iowa caucuses are in theory open to all voters since participants are allowed to change their party registration on the day of the caucus. In fact, however, they tend to be attended almost exclusively by partisans.  Thus, in the 2008 Republican caucus, entrance polls indicate that only 1% of those participating in the Republican caucus were registered Democrats, while 86% were registered Republicans and 13% declared independents.  And this is where things get dicey in projecting Paul’s support.

Both the IA and the PPP polls show that Paul does much better than his opponents among independents and moderate Democratic voters, but the race is much tighter among Republicans; Paul is running about even with Romney among Republicans in the IA survey, and about 4% ahead of both Perry and Gingrich.

So, a key question for pollsters trying to gauge Paul’s support is deciding how many of the former two voting groups to include in a survey sample.  The following table compares the IA and PPP breakdown with the actual figures from 2008.

Voting Group 2008 Actual Proportion (based on entrance polls) IA Survey PPP Survey
Independents 13% 29.9% 17%
Democrats 1% 6.4% 5%
Republicans 86% 63.7% 75%

So both the IA and PPP surveys are oversampling, in comparison to the 2008 proportions, from independents and Democrats – the two groups that are disproportionately likely to support Paul.  Now, this doesn’t mean these projections are wrong.  In fact, it is not unreasonable to think that Democrats and Independents will turn out in higher proportions than in 2008 given that there’s no real race on the Democratic side in Iowa. How much higher, however, is the crucial question. If their sample projections are overestimating independent and Democratic turnout, then both automated polls are likely too optimistic in projecting Paul’s support.

Note that we see the same potential skew when we break down the respondents by ideology.  In the 2008 entrance polls, fully 88% of respondents identified themselves as either strongly or somewhat conservative, but only 11% said they were moderate and 1% liberal.  And yet in the PPP poll we find the following:

Q32 Would you describe yourself as very liberal, somewhat liberal, moderate, somewhat conservative, or very conservative?

Very liberal ……………………………………………… 3%

Somewhat liberal …………………………………….. 6%

Moderate………………………………………………… 19%

Somewhat conservative……………………………. 36%

Very conservative ……………………………………. 36%

In short, only 72% of respondents fall into the conservative range – a full 16% lower than in 2008, while 9% are liberal – 8% higher than in 2008, and 19% are moderate – also 8% higher than four years ago. (The IA topline results do not show the ideological breakdown of their respondents.)

Note that the party and ideological proportions also affect candidate favorability ratings. Paul’s favorability rating is about 8% higher among independents than among Republicans, while Gingrich’s unfavorable margin is much higher among independents and Democrats. Similarly, Paul is viewed much favorably by independents, while Gingrich does better among conservatives.

So, are these surveys wrong?  Not necessarily. In fact, I don’t know how many independents and Democrats will turn out on January 3rd – and no one else does either.  Both PPP and IA are making perhaps very reasonable assumptions that the partisan and ideological proportions will not be the same as in 2008, and that groups favoring Paul will turn out in much higher numbers. They could be correct, but we have no way of knowing. And that is important to keep in mind when you read media coverage of these polls in the next few days. The media narrative will undoubtedly suggest that Paul is surging in Iowa.  It may even be true. In the long run, however, a candidacy that depends on independents and Democrats is not likely to capture the Republican nomination.

Don’t Fear The Reaper? The Latest Iowa Poll Results

What if the Iowa caucus results don’t matter?

I raise the question in light of the most recent Iowa poll that shows Gingrich’s support almost halved during the last two weeks, from about 27% to 14%, putting him third behind Paul (23%) and Romney (20%), both of whom saw their numbers remain relatively stable.

Q2 If the Republican candidates for President were Michele Bachmann, Newt Gingrich, Jon Huntsman, Gary Johnson, Ron Paul, Rick Perry, Mitt Romney, and Rick Santorum, who would you vote for?

Michele Bachmann ………………………………….. 10%

Newt Gingrich …………………………………………. 14%

Jon Huntsman…………………………………………. 4%

Gary Johnson …………………………………………. 2%

Ron Paul ………………………………………………… 23%

Rick Perry ………………………………………………. 10%

Mitt Romney……………………………………………. 20%

Rick Santorum………………………………………… 10%

Someone else/Not sure ……………………………. 7%

(The best part of the PPP poll? 31% of respondents think Barack Obama was not born in the United States, and 21% aren’t sure.  Donald Trump can still win this race!) The RealClear politics aggregate polling now show Newt (green) in essentially a dead heat in Iowa with Paul (brown) and Romney (purple), but the trend lines are going in the wrong direction for the Newtster.

This is to be expected given the blanketing of the Iowa airwaves with anti-Newt advertising – much of it financed not by other candidates, but by the so-called superpacs working on those candidates’ behalf.  For example, since Newt rose to the top of the polls a Romney shadow PAC called Restore Our Future has spent several million dollars funding at least one attack ad targeting Gingrich and another favoring Romney. Paul, of course, has been running his “serial hypocrisy” ad against Gingrich for a couple of weeks now.  At the same time, these groups are running positive ads for their own candidates as well – here’s one supporting Rick Perry:

All this is taking a toll on Gingrich’s poll numbers, particularly since he still has a minimal media presence in the state.  He is now the second choice of 13% of Iowans, essentially tied in that category with Perry, Romney and Bachmann – but behind “Someone else/Not Sure” at 18%.  His favorability/unfavorability numbers have declined to 46/47, behind the more positive numbers of almost everyone else except Huntsman.

Of perhaps greater significance than Newt’s slide, however, is where his support is going. It’s not to Paul or Romney, both whom are essentially treading water in Iowa.  Instead, it appears that former Newt backers are now splitting their support between Perry, Bachmann, and Santorum, all of whom are at 10% in the last PPP poll, and whose aggregate polling trend lines are all inching north.

This raises an interesting possibility. Historically, Iowa serves two purposes. First, the winning candidate can get a boost in media coverage and funding, particular if the victory exceeds media expectations. Think Obama in 2008.  Equally important, however, Iowa has often served a winnowing function, culling second-tier candidates from the field.   A lot can happen in two weeks, of course, but right now Iowans don’t seem prepared to rule any Republican out of the race.  Fully 37% of Iowans still say they may support someone other than the candidate they are currently backing. That’s a lot of uncertainty.  The current conventional wisdom is that a candidate must finish in the top three in Iowa to remain viable. I’m not sure that’s true.  If there are three, or four, candidates  who each get 10-12%, and who are clustered behind the two leaders (say, Romney and Paul),  it’s possible they might all retain enough backing to stay in the race, particularly considering the proportional allocation of delegates that Republicans are using in the early contests.   Indeed, if no clear frontrunner emerges for the Republican nomination, some pundits are looking ahead to the possibility of a brokered convention.  It’s far too early to contemplate that outcome.  But it’s not too early to wonder whether, in Iowa, any Republican will be winnowed from the field after Jan. 3.  Maybe it’s true, after all – there’s no need to fear the Reaper.

Parsing the Iowa Poll: Why It’s Good News for Newt

By now most of the media outlets have picked up on the Des Moines Register poll that was released last night, but I want to address a couple of points that may have been missed in the extensive media coverage.  First, it’s worth reminding everyone that polling a caucus state is much more difficult than for a regular primary because the polling outfit has to sample the population of likely caucus voters, which is quite small.  Part of the reason the Des Moines poll garners so much attention is that it generally has a good track record in forecasting the caucus results.  (The paper has been running this poll going back to the Reagan years, so they have some experience in polling Iowa caucuses).  Nonetheless, there are lots of assumptions built into the forecast that leave room for error.  And, there’s still a month and several Republican debates to go. Note that only 28% of those polled in Iowa say their mind is made up.  A lot can happen to change the dynamics on the ground there.

With those caveats, I want to highlight a couple of interesting findings from the actual poll. As I noted in my last post, not only does Gingrich lead among likely caucus voters with 25%, he is the second choice of 18% of the survey respondents, which also leads the field.  In terms of second choice candidates, Romney is second with 15%, and Perry third at 12%.

Gingrich also has the second fewest votes for “least liked”, with only 6% of respondents designating him as such. Santorum leads with only 4% choosing him as least liked.  Romney and Bachmann, however, tie for the lead as least liked, with both getting 15%.

When asked which of the candidates whom they haven’t seen they would most like to see, Gingrich leads the field with 26% of respondents saying he’s the one they want to meet. That suggests that he has potential to win over more voters.  Romney, in contrast, is grouped down with the rest of the field with 15% of respondents saying he’s the candidate they most want to meet.

When asked about various candidate qualities, Gingrich is the overwhelming choice as the most knowledgeable (58%), most experienced (58%) and most like Ronald Reagan (28%).  No one else comes close in these categories.  He also has a slim lead over Romney (22-20%) as most likely to turn the economy around. Finally, Gingrich finishes first as the candidate most likely to bring change, with 27%, followed by Paul at 18%.

However, it is not all bad news for Romney. He is viewed as the most “presidential” (34%) and “most electable” (38%).  Gingrich is a respectable second in those categories.

On the whole, the internals of this poll are more favorable to Gingrich than even the top number showing Gingrich in the lead.  And they raise a critical question for Romney:  Is it even worth devoting resources to Iowa, thus raising media expectations that may be hard to meet?  The answer, I think, may turn on whether Romney calculates that his superior resources will allow him to turn out the vote in numbers greater than suggested by this poll, and that Gingrich will be unable to translate his polling support into actual votes.  Keep in mind that four years ago this calculation didn’t work in Romney’s favor, as Iowan conservatives coalesced behind Huckabee even though Romney spent scads of money in the state.  In looking at the poll results, I can see this same dynamic unfolding in January, with many caucus participants opting for their second choice option.  Note that this poll was in the field before Cain announced that he was suspending his campaign.   The wildcard is Paul, but as I noted yesterday, while I’m sure he’s going to win his 15-18%, the polling results indicate that may be his ceiling; he’s the second choice of only 7% of likely caucus goers.

I’ve discussed in previous posts how Romney might change his strategy to take on Gingrich, so won’t belabor the point here.  Interestingly, the Republican establishment continues to believe – or to hope – that Gingrich’s candidacy is flawed, and that he will implode, ceding the field to Romney.  But if I’m Mitt, I would pay less attention to what the experts keep saying, and more to what the polls indicate is actually going to happen in Iowa.

Is Obama “Unbeatable”? Whistling in the Graveyard of Trial Heat Polling

Is Obama unbeatable in 2012?  With the economy showing no signs of recovery, joblessness hovering above 9%, the poverty rate on the rise, median income dropping, Obama facing the lowest approval ratings of his presidency and with his favorability rating now below 50%, and with the recent release of Ron Suskind’s book that purports to show a president not in charge of his own White House, you might think the obvious answer is a resounding “NO!”

According this article by Tim Noah at The New Republic, however, you might be wrong. Noah rests his case on recent trial heat polls that show Obama easily coming out ahead in one-on-one match ups against his main Republican rivals. For example, in this Public Policy Polling survey that was in the field shortly after the President’s job speech, Obama bests each of the five top Republican candidates.

For Noah, the fact that Obama is still beating his opponents in trial heat polls despite the dismal economic climate and his own administrative struggles indicates his strong position going into 2012.  Indeed, Obama’s biggest worry, Noah warns, may be that “these [trial heat polling] numbers might make him overconfident. How lucky can you get?”

How lucky indeed?  Alas, for Noah and other Obama supporters, given the current electoral fundamentals, pinning one’s hopes on trial heat polls taken this far before the election is the epitome of whistling in the graveyard.  In fact, history shows that these early polls are not reliable predictors of actual election results. As evidence, Sarah Pfander and Owen Witek went back and examined previous trial heat polls between the incumbent president and the opposition candidate at roughly this same point in the calendar, and compared the surveys to the election outcomes. Because prior to 1980 only Gallup consistently polled more than a year before the election, I’ll focus here on trial heats for the five most recent elections involving an incumbent president, dating back to 1980.  The findings suggest that Obama supporters should not rest their hopes on the results of trial heats this far out.

Let’s start with the 1980 election.  In trial heat polls in April and August of the previous year, Ronald Reagan ran about even with Jimmy Carter, but with large numbers of voters saying they were undecided.  By January, 1980, however, Carter was leading Reagan by 62%-32%! As late as June, 1980, Carter was still polling ahead of Reagan by 6-7% in trial heats.  Of course, Carter lost that election by almost 10% in the popular vote.  Flash forward to 1984. In August, 1983, and again in January, 1984, Reagan and Mondale were tied in trial heat polls.  Reagan, of course, went on to crush Mondale by almost 20% in the popular vote. It doesn’t get better from here. In 1992, of course, Bill Clinton was a virtual unknown, but in the earliest trial heat poll from January of that year, the incumbent George H.W. Bush was beating him by 15%.  In fact, Bush lost to Clinton in a tight race.  In 1996, the trial heat results are complicated because pollsters assumed Ross Perot would again be the third-party candidate, and he was often included in early surveys between Clinton and Dole. Nonetheless, the earliest survey we could find, from late 1995, has Clinton ahead of Dole by 11%, with Perot running third.  However, a Gallup Poll from January 1996 without Perot has Clinton’s lead over Dole down to 4%.  Clinton, of course, won handily by almost 9%.  Finally, in 2004, two polls from 2003 have Bush leading Kerry by 15% and 3%.  The latter survey came closer to the actual results; Bush won by a bit more than 2%

The following table put together by Witek summarizes the results of the those trial heat polls taken closest to the current point in the 2012 election calendar, and compares them to the actual poll results.  This is a rough guide, of course, but as you can see, except perhaps for 1996, they are completely unreliable indicators of the likely popular vote results and in three of the cases they don’t even predict the winner. (I don’t count the 1984 trial heat as a correct prediction since it falls within the poll’s margin of error.)

Election Year Trial Heat Prediction 10-14 Months Before Election Actual Winning Margin Net Difference Projected vs. Actual

1980

Even Reagan +9.75

9.75

1984

Reagan +1 Reagan +18.2

17.2

1992

Bush +15 Clinton +5.5

20.5

1996

Clinton +11 Clinton +8.5

2.5

2004

Bush +15 Bush +2.5

12.5

If trial heat polls this far out don’t tell us much with a great deal of confidence, when can we begin to rely on them to accurately predict the election outcome?  Brendan Nyhan, in this article cites more systematic research by political scientists Christopher Wlezien and Robert Erikson indicating that, not surprisingly, trial heats’ predictive power increases as we get closer to the election.  Indeed, their accuracy grows in almost linear fashion, as indicated by the following chart from the Wlezien/Erikson paper.  It shows trial heat polls’  predictive reliability increasing the closer we get to election day.  (Think of the left-hand axis as measuring how much of the final outcome can be predicted from trial heat polls, with “1” indicating that polls are in effect perfectly predicting the outcome.)

This is because as voters begin to pay attention to the race, the fundamentals that influence how they are likely to vote also begin to drive the trial heat results.  In short, when we get to Labor Day – or about 60 days before the election- we should see a closer convergence between trial heat polls and what our forecast models predict based on these fundamentals.  At this point about two months before the actual election, of course, many political scientists issue their forecast models based on those fundamentals.

Meanwhile, there will be undoubtedly be many more trial heat polls during the coming months and they will receive a good deal of media coverage, particularly as pundits’ cherry-pick the results that seem to support their preferred candidates.  In truth however, the entertainment value of these polls is greater than their predictive value, and the media coverage of them should be judged accordingly.