Thanks to all the LIS staff who responded to the LIS Website Team’s survey! There were 63 responses to our 2009 survey, prior to the redesign of the LIS Website, and 24 responses to our more recent survey, after the launch of the new site. In this post, I will share some of the results of these surveys and compare the feedback between the two surveys. I’ll discuss the student survey in another post.
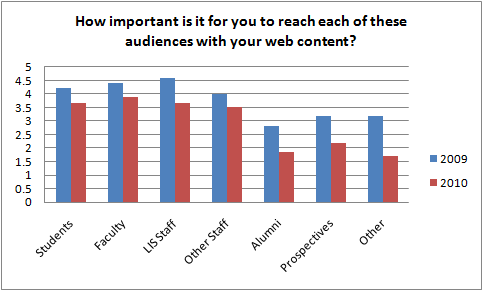
Question 3: How important is it for you to reach each of these audiences with your web content?
There was little change between the 2009 and 2010 surveys in which audiences LIS staff see as the primary visitors for their sites. In general, LIS staff now feel that it is less important to reach all of the audiences, but reaching students, faculty and staff remain the primary audiences. Faculty is now the most important audience, where LIS staff had been the most important audience on the 2009 survey.
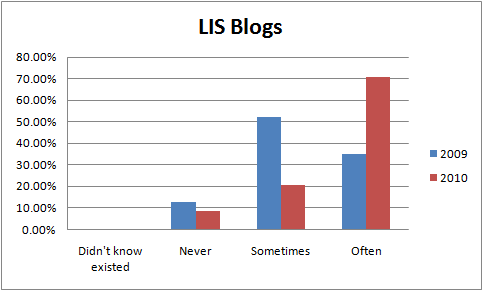
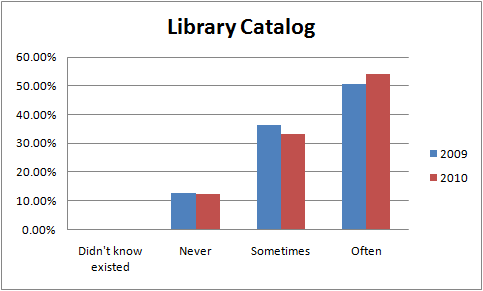
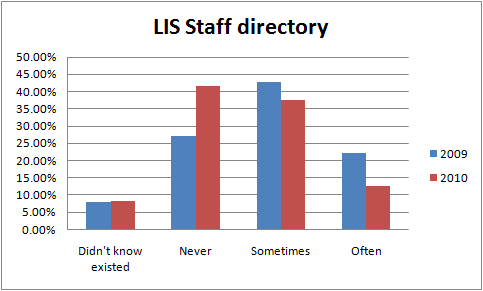
Question 5: How often do YOU use these LIS website features?
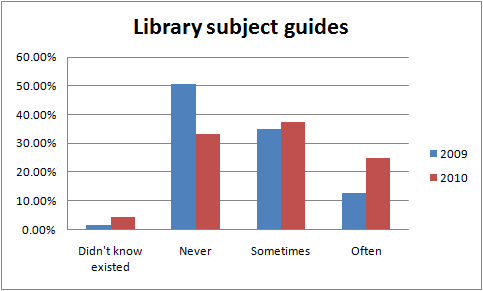
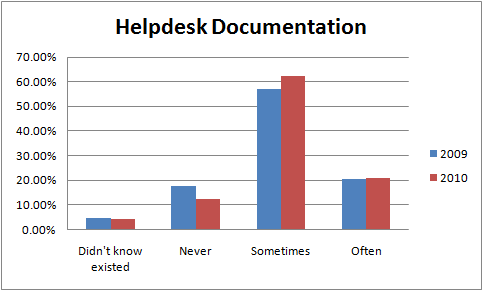
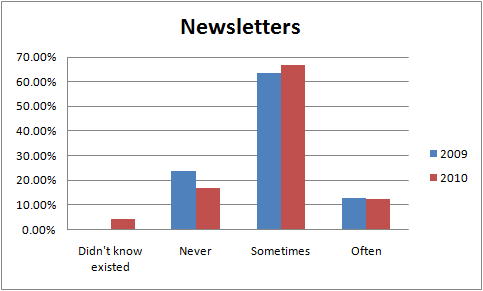
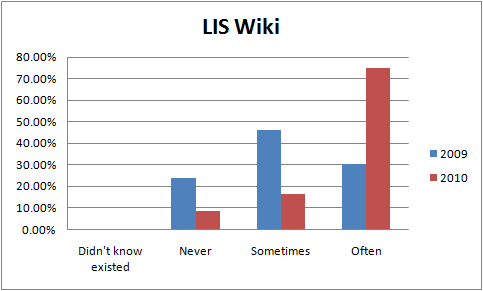
There was little change in the usage of LIS website features between the 2009 and 2010 surveys. There was a slight increase in the use of LIS Blogs and the LIS Wiki, which we anticipated as we’ve focused a large amount of effort to improve both of these platforms in the last year, particularly by adding documentation to our wiki. The only service that saw decreased usage was the LIS staff directory.
Because of the smaller number of responses on the 2010 survey, the increase usage of the LIS Blog and LIS Wiki is not noticable until you examine the responses for each category as a percentage of the total responses. This view for each of the items is shown on the charts below.
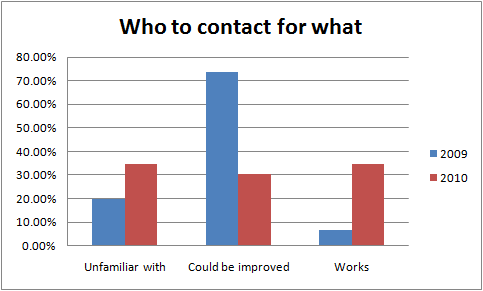
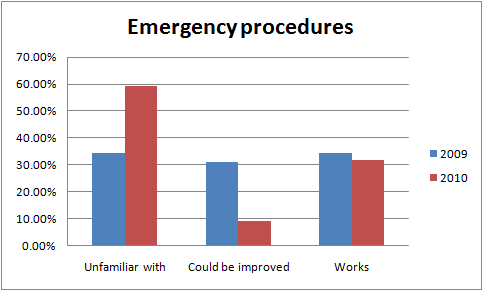
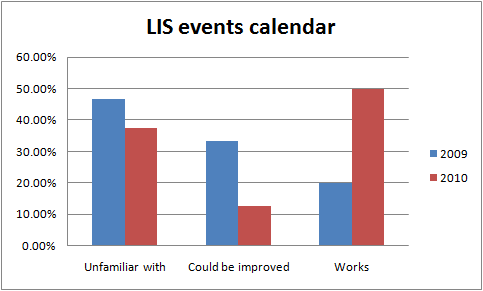
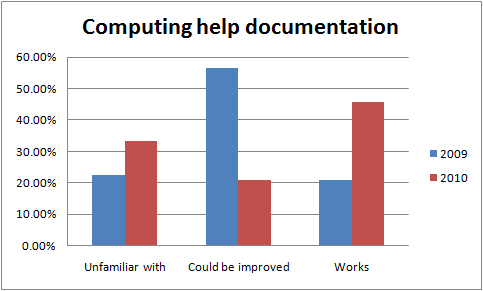
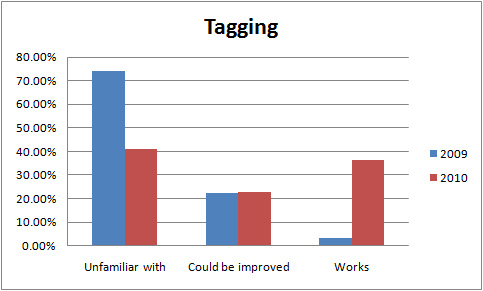
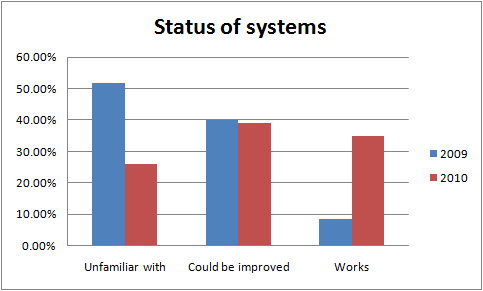
Question 6: What features of the LIS website could be improved?
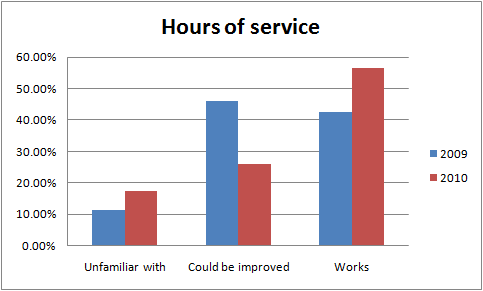
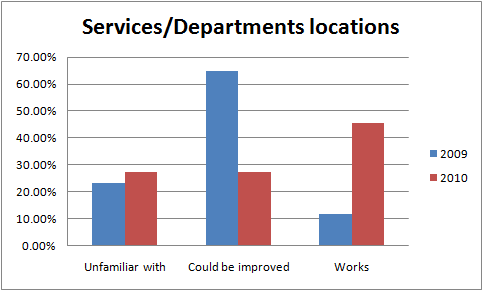
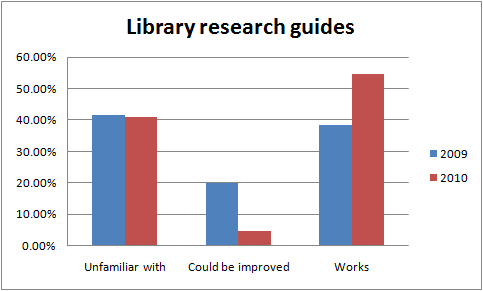
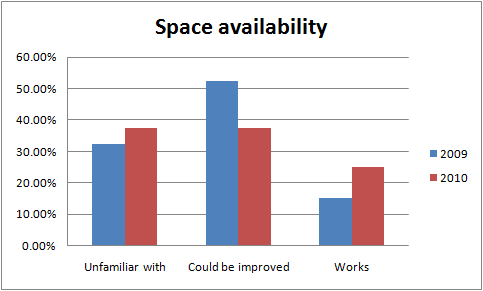
There is a clear trend with each of the responses to this question: many of the staff who felt that each of these features could be improved in 2009 now feel that these features work on our site! However, there remains a large segment of LIS staff who are not aware of these features of the LIS site, suggesting both that LIS staff may not visit the LIS site often and, for those who do, we need to do a better job of promoting these features.
The one exception to this trend is emergency procedures, where fewer respondents in 2010 believe this section of our site works and a larger percentage are unfamiliar with this content. Given the nature of this information, especially its importance to LIS staff who were the subjects of these surveys, we need to focus on improving access to this information. Hours of service and space availability were other areas that saw less improvement than other features of the site, though both were improved between the two survey groups.
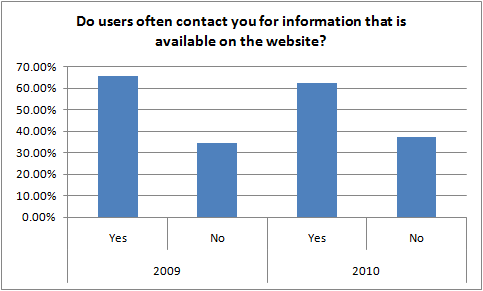
Question 7: Do users often contact you for information that is available on the website?
There was little change in the response to this question between 2009 and 2010, which might suggest that we need to improve advertising of the website as a primary source for information, or steer people who contact us to the website to find the information. We should ask people who contact us whether they checked the website to find this information first to determine if the issue is people not using self-service methods to get information or if the information is too difficult to find on the site.
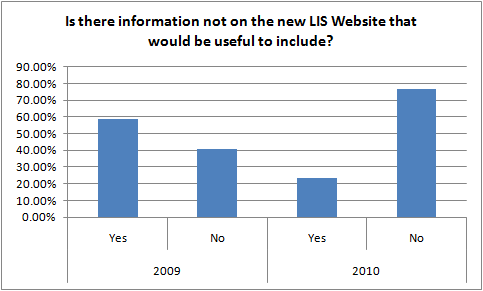
Question 8: Is there information not on the new LIS Website that would be useful to include?
The 2010 survey shows a dramatic improvement in this metric. I believe this is a result of the process we conducted to transfer information to the new website: all information had to be transferred by hand so people doing the work put a lot of though into including only the necessary information. It’s also probable that the permissions system for our new site, which allows areas to add people to work on the site as needed, helps keep the site up-to-date as new staff can be added to work on a site.
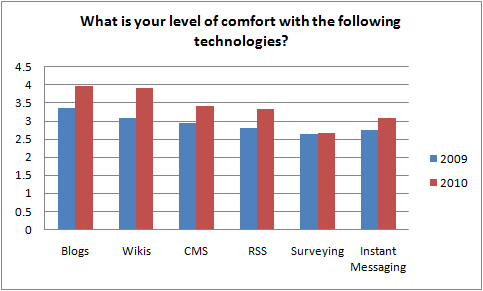
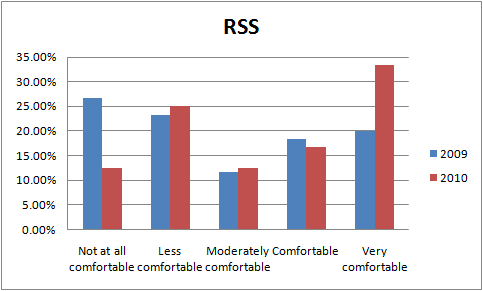
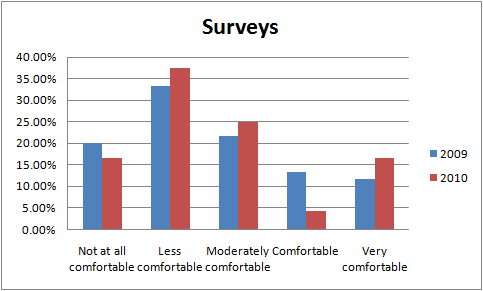
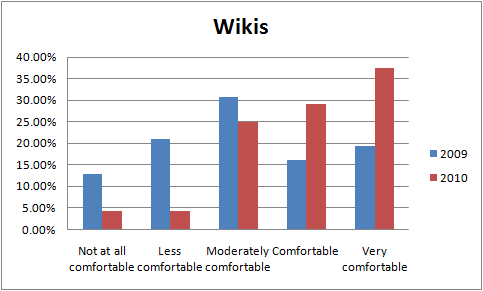
Question 9: What is your level of comfort with the following technologies?
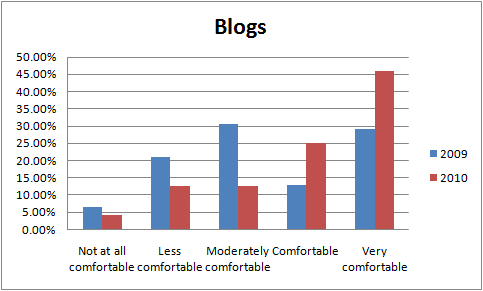
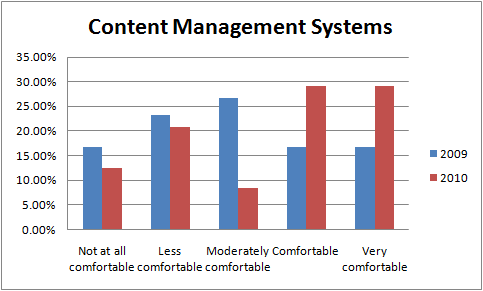
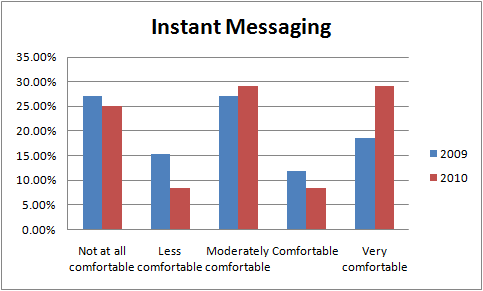
Overall, LIS staff are more comfortable with all of the technologies listed than they were in 2009. The largest growths in comfort were with Blogs and Wikis, probably as a result of their emphasized use as part of the new LIS website. The most pronounced growth in the highest level of comfort was with the use of RSS.
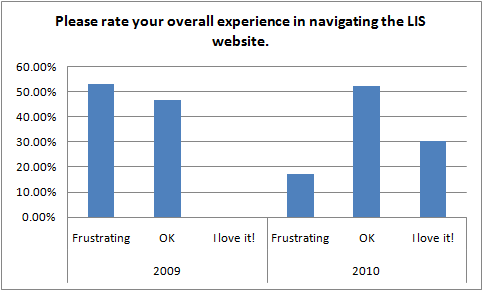
Question 11: Please rate your overall experience in navigating the LIS website.
Most LIS staff still only feel ‘OK’ about navigating the website, but far fewer find it frustrating and some people actually love it now.
Data Sources
Here are exports of the data used to create these charts. If you think I’ve misrepresented the information, please feel free to post your own results based on this data. Let us know your thoughts about the survey results in the comments section here. Thanks again to all of the staff who participated!
