Tag Archives: forecast models

The Election Forecast: It’s The Fundamentals, Stupid!

Political scientist Lynn Vavreck posted an interesting New York Times column a couple days back in which she noted that midterm elections – more so than presidential elections – are referendums on the president and his party. As she writes, “Instead of rewarding or punishing the incumbent president for his handling of the nation’s economy, in midterm years voters address the president more directly — by penalizing his party members, on average, but also by calibrating that punishment based on how the president is doing his job. Average approval ratings of the way the president is ‘handling the job’ explain more of the variation in seat loss than the economic indicators.”

What Vavreck is referring to is the well-known “midterm” loss phenomenon which I have written about on multiple occasions. Briefly, as political scientists have documented, the president’s party on average loses about 28 House seats and 4 Senate seats in midterm elections during the post-World War II era. There are several explanations for why this is the case, but Vavreck cites one – the “surge and decline” thesis that points to differences in the size and composition of midterm elections versus presidential elections as a primary reason why the president’s party does less well in off-year elections. Strictly speaking, of course, the surge-and-decline thesis is not necessarily a referendum on the president’s performance so much as a fundamental aspect of turnout differences. Historically, as this chart indicates, midterm turnout in recent years hovers at about 40% – these are the habitual voters who turn out every election, whereas in presidential elections we see more variation and usually higher turnout. (This data is from Michael McDonald’s site.)


In 2010, turnout was about 41% of eligible voters, but it was about 58% in the 2012 presidential election.

But, it is also the case that beyond simple turnout factors, midterms are also directly referendums on a president’s performance. From this perspective, how one votes in the midterm is a direct reflection of a voter’s attitudes toward the President. As I’ve discussed in previous posts, congressional candidates – as strategic actors – are very much aware of when the President is a liability. Under those conditions, they have an understandable desire to keep him at arm’s length, as we have seen in “purple” state Senate races in Colorado, Iowa and New Hampshire this fall.

In their forecast models, political scientists try to account for both the surge-and-decline and the referendum factors by including a midterm variable, but also a measure of the president’s approval ratings. However, we do not want to overstate the degree to which the midterm is all about the President. As this table from Pew shows, even during the current election cycle, only about 32% of voters see their midterm vote as driven by opposition to Obama, while 20% say it is a vote in favor of Obama. That means 45% of those surveyed say their midterm vote has nothing to do with the President! And, as the chart indicates – that’s not unusual; many people in past midterms say their vote is not a referendum on the president’s performance.

http://www.people-press.org/files/2014/10/10-23-2014_04.png

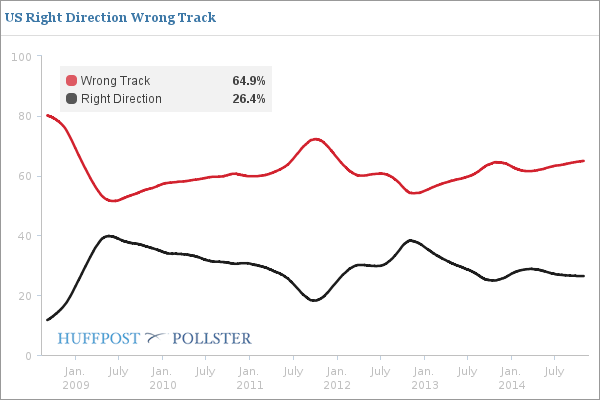
So, if not just the president – what is the midterm about? One factor is a general assessment of how well the country is “doing”, captured in questions asking whether the country is on the right track or not. Here we see that most people think the country is currently on the wrong track.

right track

Another influence is the relative preference for one party or the other, often measured in the generic ballot question.

generic ballot

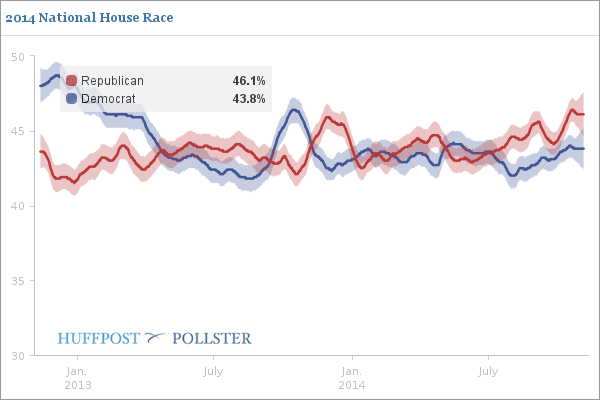
On this measure Republicans also have a slight advantage. Finally, the economy does matter, even in midterm elections, and some measure of economic conditions is often included in fundamentals-based forecast models. For example, Michael Lewis-Beck and Charles Tien include a measure for changes in disposable income in their forecast model.

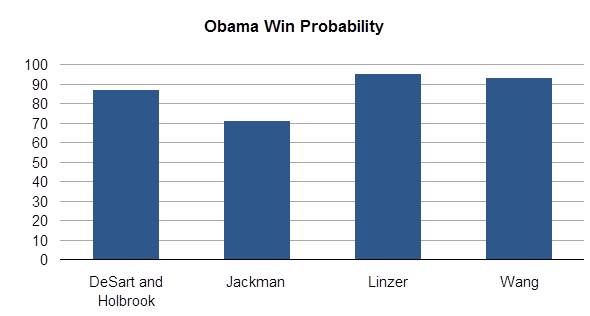
When we incorporate all these variables into a “fundamentals”-based forecast for today’s midterm elections, what do we get? Middlebury student Day Robins put together this chart summarizing the predictions made by several political science forecast models. (Note that some models only forecast House results, some only Senate, and some do both.  Note also that most forecasts do not estimate a probability of a party taking over a chamber.)Picture1
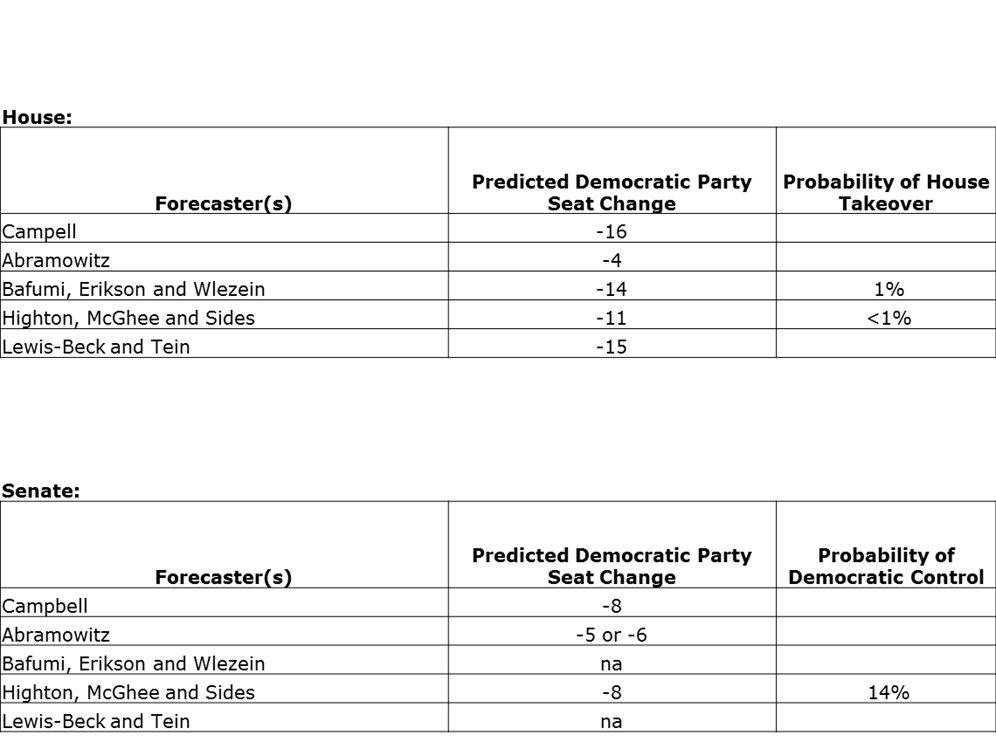
Note that these models are not driven by the same logic that drive predictions based on poll aggregation, such as those by Drew Linzer at the Daily Kos or Mark Blumenthal’s Huffington Post. Poll-driven models are likely to be very accurate – maybe more accurate than fundamentals-only polls – but they don’t tell us why the polls turn out the way they do. For that, we need to turn to political scientists. And, as Robins’ chart makes clear, the fundamentals – the fact that this is a midterm, the President is unpopular, Democrats have more exposed seats, the economy is sluggish and generally more people think the country is on the wrong track – does not bode well for Democrats in either the House or the Senate. How badly will they do? On average, the models indicate Democrats will lose 12 House seats, with the median figure 14. In the Senate, the models say Democrats will lose on average 7 seats, dropping them to 48, with the median at 8 seats. Both forecasts sound right to me. To make it official, I’ll go with a Republican pickup of 8 Senate seats and 14 House seats. That will give you all something to root against tonight!

No turnout machine, no matter how sophisticated, can make much of a dent when the fundamentals mean you are moving electorally against a strong partisan headwind.

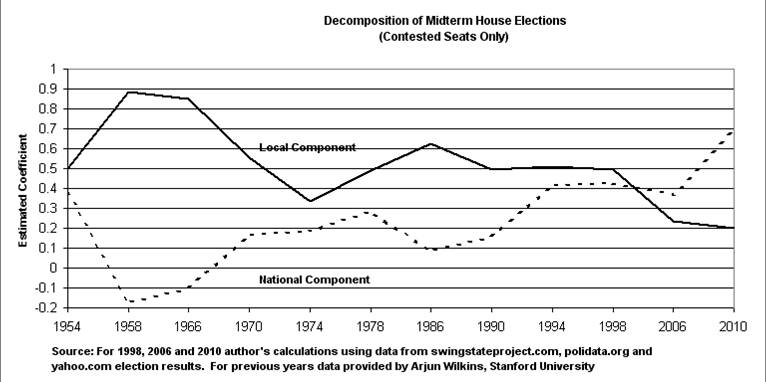
Keep in mind that, as the table above shows, as midterms elections have become increasingly nationalized, the partisan tides affect all candidates to a much greater degree. And so I expect it to go today.  This is likely to be a predominantly nationalized election, one in which, taken collectively, the fundamentals favor Republicans more so than Democrats.

I’ll be live blogging from the “Karl Rove” Crossroads Grille tonight, while simultaneously trying to keep the Middlebury students from crying in their beer. I hope you can join in – it’s been a while since I’ve been able to do a live blog.

See you at 7:30 – by then they may have already called the Vermont races!

Who Is Really Winning This Race?

Because I have been giving election talks with more frequency of late, I haven’t been able to post nearly as often as I would like.  In giving those talks, however, I am reminded (and I remind my audiences!) that, once again, looked at in the aggregate, the structural-based political science forecast models issued by Labor Day (or earlier) have proved remarkably  accurate.  For those new to this blog, the median forecast of the 11 political science forecast models that I reviewed in previous posts gave Obama 50.6% of the two-party vote.  The average forecast from those 11 models gave Obama 50.3% of the two-party vote.  Remember, this was before the debates, the tax returns, the “gaffes”, and all the other events cited by various pundits as potential game changers.  As of today, that aggregate median forecast (those who attend my talks will remember that the aggregate median forecast provides the basis of my election prediction) from two months ago looks like it will come very close to hitting the final Obama popular vote share squarely on the head if the national tracking polls are to be believed. This is no mean feat, in my book, and it is a reminder that political scientists have developed a decent understanding of the factors that drive presidential election outcomes.  It is reassuring that this election cycle has proved remarkably unsurprising in terms of its likely outcome.

Of course, while those structural models may be correct in predicting this race would essentially be a dead heat, they don’t tell us who is going to win, which is what most people want to know.  At this point, five days before the election, you are better off looking at the polls – state and national – which are probably going to be more accurate than structural models devised several months ago in predicting the winner (even if they are going to be far less useful in understanding why Obama, or Romney, won).  Several political scientists (and others) have developed Electoral College forecast models based on state-level polls, in contrast to the structural models which ignore polls entirely.  I present four of these state-based projections here. (Readers will remember that if I can’t see what goes into a prediction model, I don’t bother following its projections.  That’s a basic tenet among academics, and it explains why I ignore some of the more highly publicized state-based forecast models. )

As you can see, all four of these forecasts show, as of today, that Obama is likely to win the Electoral College vote, based on state-level polls.  This has led pundits at some sites, like this one at Mother Jones, to suggest that if all these prognosticators are predicting an Obama victory, it must be so.  But it would be a mistake to treat these forecasts as independent assessments.  In fact, all rely on the same set of state-level polls, and if the polls are wrong for some reason, all of the projections will be off as well.  Moreover, as several commentators have noted, the national tracking polls tell a slightly different story.  Consistent with the structural forecast models, they indicate that this race is actually a dead heat.   Indeed, some pundits, like Pollster.com’s Steve Lombardo, are convinced that the national tracking polls indicate that Romney is poised to win the national popular vote.  Lombardo writes,” Our current estimate (which we will update next Tuesday morning) suggests that Romney will capture 51 percent of the popular vote to Obama’s 48.5 percent. The trend line-based on 26 national polls conducted over the last 30 days –is both unmistakable and virtually unassailable.”

If Lombardo is right, there is virtually no chance that Obama will win the Electoral College vote.  The problem with this projection is that Lombardo assumes the trajectory of the trend line will continue unabated through Election Day. My read of the latest national tracking polls, however, suggests that Romney’s “momentum” has dissipated, and that the race has settled into a rather stable equilibrium, with neither candidate showing an advantage.   As evidence, consider the latest RCP composite poll, which shows the race essentially tied.

I have said all along that the state-level polls and the national polls will gradually converge.  But in whose favor?  In my next post, I’ll address evidence suggesting that Romney may benefit from an “enthusiasm” advantage among Republican voters. In the meantime, however, it is worth remembering that, once again, the “composite” political science forecast reveals that presidential elections are rather predictable affairs and that contrary to what some pundits have suggested, this election has – to date – contained few surprises.

So, who is really winning this race?  As of today, it is political scientists.

No Bread, No Victory: Why Obama Might Lose in 2012

Another day, another political science forecast.  This one, Professor Doug Hibbs’ Bread and Peace model, is one of the more parsimonious forecast efforts around.  He essentially uses two variables – a weighted average of the per capita disposable personal income growth rate across the President’s term and U.S. military fatalities in unprovoked wars – to estimate the incumbent party’s share of the major party vote.   Of the two variables, the weighted average of quarterly income growth (his personal income coefficient includes the election term growth rates dating back through the first quarter of the president’s electoral term, with most recent income growth rate carrying almost 4 times the weight as the earliest) as the single best indicator of voters’ perception of the state of the economy.  But Hibbs argues as well that a party initiating an unprovoked war will also suffer electorally, with the size of the electoral penalty increasing in proportion to the cumulative number of U.S. military casualties per capita.

The underlying logic driving the Hibbs’ model is the idea that I have addressed in previous posts: that presidential elections are largely retrospective referendums on the performance of the party in power.  Note that typically this referendum centers on the incumbent party’s handling of the economy; as this chart shows, Hibbs’ disposable income variable does a good job predicting election outcomes since 1952 all by itself.

You can see, however, that the economic variable didn’t do very well in 1952 or 1968; in both cases the incumbent  party’s candidate did  much worse than economic conditions seemingly warranted.  The reason why, Hibbs’ argues, is because voters were blaming the incumbent party’s candidate for unpopular wars in Korea and Vietnam. Hence the addition of the fatalities variable in his model.  Note that this variable will come into play, according to Hibbs, in 2012, since Obama chose to escalate the U.S. military presence in Afghanistan.  But, as we’ll see below, it won’t have nearly the impact on Obama’s vote share that the slow growth in disposable income will have.

Note that Hibbs shows particular disdain for forecast models that include what he views as ad hoc variables designed to better fit the prediction to actual election outcomes, but which add nothing theoretically.  Thus, in contrast to the Abramowitz model that I’ve discussed here and at the Economist DIA site, he has no use for presidential approval variables.  Although knowing how popular a president is may improve the forecast’s accuracy, it doesn’t tell us why the President has this approval rating. Presumably it has something to do with the state of the economy – but Hibbs already accounts for that.  (Indeed, he finds that his “bread” and “peace” variables account for almost half the variation in presidential approval ratings).  So in his view approval ratings aren’t very helpful in understanding what causes a particular election outcome.

For somewhat different reasons he dismisses the inclusion of time-related variables, including that used by Abramowitz,  that punish or reward a president depending on how long his party has held the presidency.  As Hibbs writes, “I regard the rationalizations of the time-coded variables …as fanciful and ad-hoc.”  He shows that when these time variables are removed from some of the more well-known forecast models, their predictive capacity drops substantially.

I’ve gone through Hibbs model in some detail to remind you of two points I made in my exchanges with Nate Silver regarding the difference between political science forecast models and what Silver does.  First, Hibbs’ entire forecast model is open to scrutiny by others, so that when it goes wrong, we can see why.  And that gets to the purpose of this forecasting enterprise:  political scientists want to do more than simply predict the outcome of an election.  Doing that is quite easy: just aggregate all the most recent state level polls on the day before the election. You will hit the final Electoral College vote tally almost squarely on the head.  But that doesn’t tell you why someone won the election – for that you need a theoretical explanation that you can put to the test.  Hibbs’ theory says voters in 2012 will vote largely on the basis of their evaluation of Obama’s handling of the economy and, to a lesser extent, the fatalities resulting from his decision to escalate the U.S. military presence in Afghanistan.

So this brings us to Hibbs’ prediction for 2012.  Looking only at disposable income alone, he argues the situation does not look good for Obama; the weighted average quarterly growth rate since Obama took office is only .1%, far below the post-World War II average of 1.8%.  His model suggests that the U.S. has to experience at least 1.2% growth for a president to win 50% of the two-party vote. Barring spectacular growth in the next two quarters, then, Obama is going to fall short of rate needed to win a 50% share of the vote. When you include the  Afghanistan-related casualties – actual and projected – and assuming a growth rate in disposable income of between 1 and 2% in the last two quarters of 2012, Hibbs’ projects that Obama will likely lose the election, garnering only about 47.5% of the two-party vote.

As he readily acknowledges, his forecast is something of an outlier compared to the predictions of several other political science models, including Abramowitz’s, that forecast a narrow Obama victory. Nonetheless, he is sticking by his model, albeit with the understanding that some unforeseen event or idiosyncratic factors related to this election could through his projection out of  whack.

What might those be? If  you look  at the graph above, you’ll see that his forecast model didn’t do a very good job in either 1996, where it underestimated Clinton’s vote share, or in 2000, when it overestimated Gore’s vote share. He thinks Clinton’s legendary “charm” and Gore’s rather wooden campaign style may have thrown his projections off. Of course, as I’ve noted in earlier posts, almost none of the forecast models did well in 2000, a fact that some analysts attribute to Gore’s poor campaign strategy.  Looking toward 2012, Hibbs acknowledges the possibility that idiosyncratic factors associated with election-year issues and candidate characteristics could come into play.  Among the former are controversies regarding gay marriage and immigration policy and the recent Court ruling upholding the Affordable Care Act.  Of the latter, Romney’s Mormon faith could turn some voters away.  Interestingly, Hibbs does not view Obama’s race as one of them, declaring that because of Obama’s 2008 victory:  “Race will never again figure significantly in presidential politics, and that will be Obama’s greatest positive legacy to Democracy in America.”

Note that the Hibbs model is not without its critics. As Harry Enten tweeted, one might take Hibbs to task for the rather ad hoc nature of his estimate of the impact of fatalities on vote share, which varies by wars.  Moreover, Hibbs gives presidents a “one-term grace” period for wars inherited from a previous administration of the opposing party.   Some might argue that this is no less ad hoc than the inclusion of a time variable that rewards the incumbent party for holding office for one term, but penalizes that party after three presidential terms.  The important point, of course, is that we can make these criticisms because Hibbs shows us his model, warts and all.

And this brings me to a more general point.  In 2008, as I noted in my Economist post, political  scientists seeking to predict the outcome of the  presidential race had it rather easy, since the contest was not that close.  Every forecast model, save one, predicted Obama’s victory. However, it may very well be the case that in 2012, the forecast models will be equally accurate in terms of projecting the likely vote share, but that a number of them won’t get the winner right. That’s because the forecasters usually construct a confidence interval along with their forecast – that is, they are really estimating the probability that a candidate’s share of the major party vote will fall within an upper and lower value. So, for example, if a forecast model projects Obama to win just over 50% of the vote, but with a 95% confidence interval ranging from 49.1 to 51.1, and Obama ends up losing the election with 49.3% of the vote,  that is still a pretty damn good projection by political science standards.  That is, the model worked as well as any forecast model can hope to work, even if it didn’t predict the winner. This point, of course, will be lost in the post-mortem of the “incorrect” forecast models by critics, but it’s worth stating now because by all measures to date this election remains one of the closest in recent memory – one that may be too close to call given the uncertainty associated with most forecast models.

And this is a reminder, once again, that for political scientists,  predicting the election winner is a means to an end – it’s not the end itself.

UPDATE: 12:50.  Since I’ve already gotten several emails about this – yes, I think there are potential flaws in Hibbs’ model.  To begin, he has decided that Obama will pay a penalty for the casualties resulting from the Afghanistan “surge” he initiated. To Hibbs,  this evidently counts as an unprovoked war.  But one might easily argue that he inherited the war from Bush, and that he established a deadline to withdraw troops after the surge – and was it really an unprovoked war in any case?  Add to that the credit he will receive for orchestrating Bin Laden’s death and maybe the negative impact of the war will actually be a positive?  On the other hand, Hibbs’ final estimate doesn’t put  much weight on the  war variable – it costs Obama maybe .25% of the popular vote share.  His estimate is almost entirely a function of the sluggish economy.  And Hibbs’ model does have a good track  record.

*Hat tip to Mo Fiorina for alerting me that the latest Hibbs’ forecast was up.

Changing the Abramowitz Presidential Forecast Model: Is It Science?

Beginning today I’ll be posting on a weekly basis (or more frequently) over at the Economist‘s Democracy In America blog site.  My first post, addressing Alan Abramowitz’s recent changes to his presidential forecast model, is up there now (here).  Although I can’t cross-post anything I write for the Economist here, I will be sure to put up a link whenever I post there, and I encourage you to take peek.

As you might expect, given the Economist’s audience, I may have to be just a bit less irreverent and insouciant (you aren’t likely to see an entire “conversation”” with Sarah Palin written in palindromes, or political allegories involving Kim Kardashian for example), but otherwise I plan on addressing the same issues, from the same non-partisan perspective, as you’ve come to expect here at the Presidential Power site.  And I will continue posting here as well – we’ve built up a pretty good readership over four years and I enjoy the bipartisan and thoughtful nature of the comments and the intellectual exchange.  You don’t  get that at very many political blogs.

So, go take a peek at my inaugural post at the Economist, but remember to check back here for my regular postings.  As always, if you prefer to be put on the distribution list for postings here, drop me an email at dickinso@middlebury.edu.  Your email address remains private.

A Turning Point In The Election?

The reaction – or lack thereof – among voters to the Bain controversy once again illustrates an important distinction between how partisan pundits (you know to whom I’m referring) and political scientists analyze what drives election results.  As the controversy over when and to what degree Romney severed his connection with Bain dominated the news, Romney’s partisan critics were convinced that the story would negatively impact Mitt’s electoral support.  The Daily Dish’s Andrew Sullivan, tweeting the link to his longer analysis, wondered: “The GOP’s current candidate is an obvious perjurer and thereby a felon. How long will it take before this sinks in?”  Jonathan Cohn, citing the Obama campaign’s “devastating ad” [based on the Bain controversy], concluded that “substantively speaking, this controversy is largely telling us something we already knew: That Romney helped develop and then employed business practices that generated large profits for investors, made companies more efficient, and frequently led to layoffs.”  TPM’s Josh Marshall confidently opined “We can spin these out forever. But beyond all the specific accusations, they’re painting a picture that makes Romney look ridiculous, like a joke. They’re making Romney look stupid and powerless on the front where he believes he’s one of the standouts of his generation. And that’s plain lethal for a presidential candidate. But how does it come into play? Simple. Mitt Romney has two claims on the presidency: successful governor of major state and captain of industry. He’s largely written off the first by disavowing a genuine and perhaps far-reaching accomplishment: health care reform. Which leaves him with Bain Capital.”

Regular readers of these partisan blogs could be excused for expecting that the fallout from Bain would have a significant effect on Romney’s standing in the polls. (I trust I need not give you a Kevin Drum quote?) And, in fact, polls indicate the Bain controversy had some negative impact on whether voters viewed Romney’s business record as a reason to vote for him. But while Romney’s critics were touting this finding, they were generally ignoring the bigger polling picture, which is that the Bain controversy did not seem to affect the candidates’ relative standing in the national polls at all, much as I suspected it wouldn’t. Indeed – and I wouldn’t make too much of  this given the rampant polling fluctuations to date – the Real Clear Politics aggregate poll suggests that Mitt may have gained ground during the time of the Bain/income tax debate.

The fact that potential voters could change their attitude toward the relative worth of Mitt’s business experience, but not whether they are likely to vote for him drives home a point I’ve made repeatedly, but one which partisan pundits overlook: this election will be largely a referendum on President Obama’s handling of the economy. For most undecided voters, the choice whether to vote for Romney will turn less on his Bain record, or how far back he goes in releasing tax forms, and more on Obama’s economic record.

In that vein, the topic of this Wall St. Journal story is likely to have a bigger impact on the November election than are any of Mitt’s tax documents.  Less than a week before the first estimate of second quarter GDP growth figures are released this Friday, a survey of economists indicates that they believe the numbers will show worse growth – close to 1.2% – than the 1.9% in the previous quarter, and the slowest rate of growth since the first quarter of 2011.

As I’ve discussed previously,  GDP growth is an important variable in many of the economy-driven econometric presidential forecast models (see here and here and here).  If these GDP numbers hold in the less-than-1.5% growth range, most of those models suggest Obama will get less than a 50% share of the two-party vote come November, although how much less varies by model – and by what the third quarter GDP number – and the final number before the election – shows. Of course these models are not foolproof, and there is always the chance that the election will turn on some idiosyncratic factor that may prove determinative.  Karl Rove has always insisted that the last minute release of court papers documenting George W. Bush’s DUI arrest on the eve of the 2000 presidential election cost Bush close to 2% of the popular vote through a combination of reduced turnout and the loss of some independents to Gore, as well four states in the Electoral College. Had the arrest not been publicized, he argues, Florida would not have mattered.  Whether Rove is correct or not, I have said repeatedly that in a close election there is room for an “October surprise” to make a difference.

But it is far more likely, I think, that the outcome will turn on perceptions regarding the state of the economy, as measured by GDP growth, among other factors.  Which makes Friday’s release of the first estimate of the second quarter GDP figure potentially far more important than Mitt’s tax returns. And if that number suggests growth is slowing, and the third quarter GDP number that will come out in October shows even slower growth, the President may have to pin his reelection hopes on an October surprise – and a very big one, at that.  This is not, of course, what partisan pundits will have you believe.  But it is what the historical record suggests to be true.

4:10 P.M.  Consistent with some of my earlier posts, Rasmussen finds that among undecided voters, only 13% are paying attention to the campaign – another reason why  Bain and the tax documents simply aren’t having the impact partisan pundits had predicted.