
It’s nearly Labor Day, the traditional kickoff to the stretch run of the presidential election. It’s also the time when political scientists begin unveiling the result of their presidential election forecast models. Some of these represent preliminary snapshots of the race, pending final third-quarter economic results and other data, but to the extent that the economic conditions aren’t going to significantly change, they offer a useful first take on the likely outcome of the race for the presidency.
Before looking at the forecasts, it’s worth discussing why scholars find these forecast models so useful. In putting together a model based on a few moving parts – say, some measure of the economy, the time a party has held the White House, the president’s approval rating – to predict an election, scholars are in effect constructing a theory that explains the vote choice. The accuracy of the model, then, is a test of how well scholars understand what drives presidential elections. In contrast, the atheoretical polls-only forecasts utilized by scholars like Drew Linzer at his Votamatic site can be remarkably accurate (Drew’s are as good as anyone’s), but they don’t tell us anything about what led to the outcome. In short, if all you care about is who is going to win, bookmark Drew’s or some similar polls-based site. However, if you want to know why a candidate won, the forecast models are a good place to start. They are not perfect, by any means, but they do offer a good first take on trying to produce a baseline for what’s likely to happen this November 8.
I’ve written in depth about these models before, but suffice to say that although they incorporate different variables, they are all premised (except for the Northpoth primary model) on essentially the same idea: when things are going well for the nation in terms of “bread” and “peace”, the incumbent party is rewarded. When things are perceived not to be going so well, however, the out-party benefits. (As I noted above, some models incorporate additional measures gauging factors such as the president’s current approval, and how long the incumbent party has occupied the White House.) It’s a deceptively simple premise, but one that is generally a robust approximator of election outcomes.
Larry Sabato has conveniently gathered five of the recent forecast models on his Crystal Ball website. As you can see, the forecasts differ in their projected outcomes, but all show a fairly close race in the popular vote. Averaging the five predictions, Democrats are projected to get 49.9% of the two-party popular vote and Republicans about 50.1%. The median forecast also has this race as a dead heat, at 50.4%-49.6% in the Democrats’ favor. In short, by these very crude aggregate measures, these forecasts collectively suggest this presidential race is most likely going to be decided by a couple of percentage points at most. Now, for methodological or theoretical reasons, you may be inclined to favor one particular model, and/or to throw one or more of these forecast models out of the sample. Just don’t do it because of what it predicts!
http://www.centerforpolitics.org/crystalball/content/images/CFP2016082502-table1.png
When I present these findings in the election-themed talks I’ve been giving these last few weeks in the largely blue northeast, my audiences invariably react with a mixture of fear, incredulity and deep, deep despair. But then I show them the national polling data! Again, as I’ve said many times before, don’t rely on single polls – look at the aggregate results. Here’s where the race stands according to the Huffpost poll aggregator.
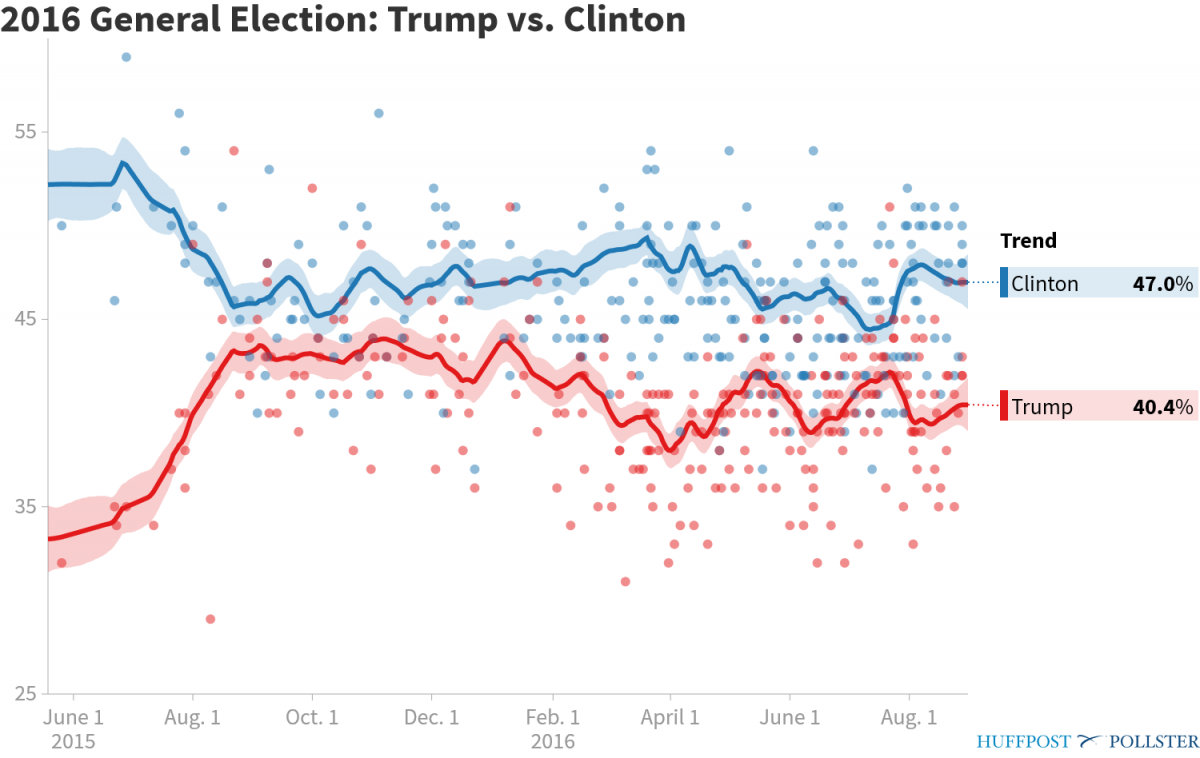
As you can see, the Huffpost aggregate polls have Clinton with a healthy 6.6% lead in the popular vote – a far more comfortable lead for Clinton supporters than what the forecast models predict the final result will be. The RealClearPolitics average also has Clinton ahead, albeit by a slightly smaller margin. But can we trust the polls? At this point in the race, about 69 days until the election, history suggests the polls are a good predictor of the final popular vote. According to research by Erickson and Wlezien, the polls at this point predict about 75% of the variance in the final popular vote totals based on previous election cycles. Moreover, as Clinton supporters are wont to point out, since 1952 the candidate who is ahead in the polls two weeks after the final convention invariably goes on to win the popular vote. Since we are now more than a month beyond the end of the Democratic convention, it would appear that Clinton must be the prohibitive favorite, right?
Maybe. It depends in part on who you trust at this point: the polls or the forecasts? In answering this question, there are a couple points worth considering. First, I wouldn’t put too much stock in that two-week post-convention metric. Dating back to 1952, there’s only been two years – 1960, and 1952 – in which the final convention ended as early as or earlier than it did this election cycle, which was July 28. It’s more typical for the last convention to conclude in late August, or early September, which would push the day of polling reckoning into a time we haven’t reached as yet during the current cycle.
On the other hand, as Erickson and Wlezien show, in recent elections dating back to 1996, the races have remained remarkably stable during the post-convention period. Drawing on their data, Sam Wang captures this phenomenon in this graph of the standard deviation (a measure of the amount of variation in the data) of the two-party polling margin in past elections. 
As you can see, the standard deviation in the difference between the two candidates has typically been three percent or smaller in recent elections. That stability, I believe, reflects the process of partisan sorting that has made each party far more ideologically homogenous, and thus making it much less likely for partisans in recent presidential elections to contemplate supporting the candidate of the opposing party. And it suggests that Clinton’s current nearly 7% popular vote lead is not going to completely dissipate in the next two-plus months.
There are, however, indicators suggesting this election cycle might not follow the pattern of previous ones, although it is not entirely clear what to make of these. First, as Linzer points out, the size of the undecided pool remains stubbornly high, at about 15%, compared to this point in the two previous cycles.
https://pbs.twimg.com/media/CrJOs2DUEAEjw3h.jpg
This means there’s more than enough undecided voters out there to propel Trump to victory, if enough break his way. But will they? Political scientists David Brady and Doug Rivers looked more closely at the undecideds in a recent YouGov survey. They found that 14% of those surveyed remain undecided (and another 14% said they would not vote.) Consistent with Linzer, they note that these numbers are historically high. In an attempt to predict how these voters would break, they asked the undecideds if there was any chance they would vote for Trump, or (in a separate question) whether they would vote for Clinton. When pushed in this manner, respondents were as likely (or slightly more so) to say they would support Clinton than Trump, although a sizable number refused to commit to either candidate. Admittedly, this is a squishy measure, but it does not provide support for the idea that there are a large number of undecideds prepared at this point to pull the lever for Trump.
It is also the case that both candidates are disliked at levels unmatched in previous election cycles. Surveys indicate that comparatively speaking voters’ choices are being driven this election cycle much more by their dislike of the opposing candidate than by their support for the other person. Still, it’s not clear why this would necessarily change the polling stability we have seen in recent elections. Indeed, there is some evidence that voters are more likely to vote as a function of opposing a candidate than they are in support of one.

So, where does that leave the race? To this point, based on the polls, Trump has underperformed the fundamentals. The reason, I think, is that he has proved remarkably maladroit when it comes to doing the things political science says a winning campaign must do: focusing the message on those aspects of the political context most favorable to your candidacy. In Trump’s case, that means emphasizing the sluggish (and rigged!) economy, the nation’s vulnerability to terrorist attacks and his opponent’s trust issues. Until recently, however, Trump has spent more time stepping on his own message by picking fights with Gold Star families and, more recently, appearing to waffle on immigration. Nonetheless, there are signs that under new management Trump has tried to discipline himself by refraining from personal attacks on political enemies, real and perceived, and by focusing much more on the core themes of his campaign. And there is some evidence that the national polls are tightening, although it’s not clear as yet how much of this is simply statistical noise associated with random sampling.
Assuming Trump can discipline himself, and can focus his campaign in a way that makes the fundamentals more salient to the remaining persuadable voters, there is reason to expect this race to tighten in the next two months. That’s not what many of my blue-state audiences want to hear. But it’s what the data and prior research tells me. Stay tuned.
Very. Interesting