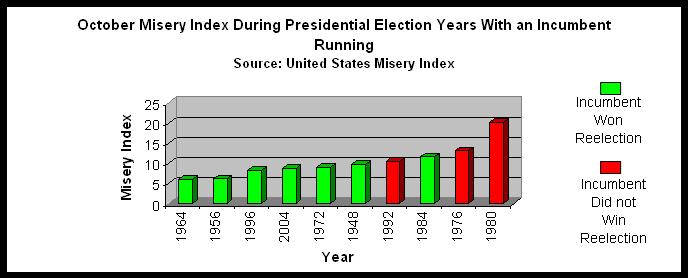
I want to follow my last post regarding unemployment and reelection by discussing a few other economic measures that are often referenced as useful indicators regarding a president’s reelection chances. One of the most frequently cited is the “misery index”, which is simply a combination of the unemployment and inflation rates. Anna Esten has put together some more charts documenting the relationship between the misery index and the electoral fortunes of incumbent presidents dating back to Truman in 1948. The following chart shows the misery index for each incumbent president in the October before the presidential election. Red indicates the incumbent lost his bid for reelection.
Not surprisingly, incumbents (Ford, Carter and Bush I) lost in three of the four highest misery index years. The exception is Reagan in 1984, but the explanation for his win becomes clear when you look at the index level four years previous, when he beat Carter. Carter lost when the October misery index was a horrendous 20.27, the highest any post-World War II incumbent faced in the month before election. In the intervening four years, however, it came down nearly 9 points, and voters rewarded Reagan for that drop.
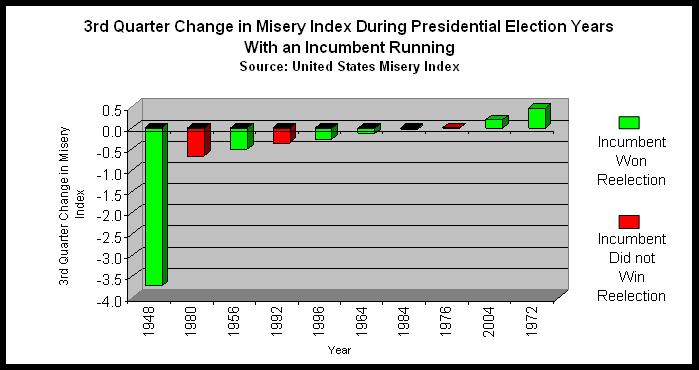
Reagan excepted, it appears that incumbents are in dangerous waters when the October misery index is hovering near double figures in an election year. Where does this put Obama? As of this past May, the misery index, driven mostly by high unemployment, was at 12.7 – clearly dangerous territory. But, of course, we are a long way from October, 2012. Moreover, one might be tempted to argue, citing the Reagan exception, that the trend in the index come next October is more important than the actual number. However, the historical record does not necessarily support this. As the following chart shows, the misery index was going down in the third quarter leading up to the elections in 1980 and 1992, but not enough to prevent Carter and George H. W. Bush from losing their reelection bids. Truman’s experience in 1948 suggests that presidents need to see a significant drop in the index to benefit. If you start in double figures, and only begin to come down as the election draws nigh, it may be too little too late.
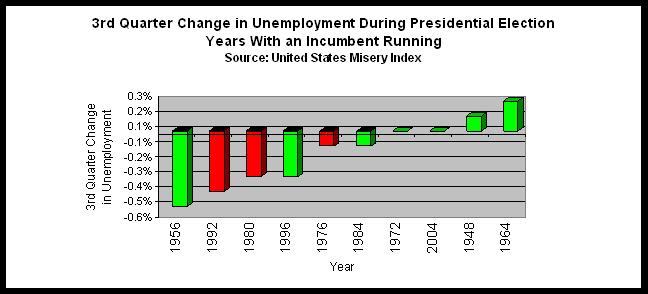
Of course, inflation has not been a major concern during Obama’s presidency – as yet. So we might think that it is the trend in the unemployment rate that will be most crucial come November 2012. But again, history does not provide Obama much solace, as this chart showing third quarter changes in unemployment rates (actually, it’s the change from July’s rate to October’s) indicates.
As we can see, a drop in unemployment was not enough to save Carter, Bush I or Ford. To be sure, Carter and Ford were combating “stagflation” – high unemployment and inflation. Jobs alone couldn’t save them. Truman, on the other hand, presumably survived the jump in the jobless rate in 1948 because it was combined with a steep drop in prices, which sent the overall misery index down. But Bush lost mainly because of concerns about jobs, even though the job picture was actually improving. It was Clinton, however, who benefited.
The more general conclusion is that perceptions about the economy seem to lag reality. That means the window of opportunity for changing voters’ attitudes regarding Obama and the unemployment rate may be shorter than we think.
Before we write off Obama’s reelection chances, however, the obvious caveats remain: First, it’s July 2011 – not July 2012. Second, we are projecting results based on 10 data points whose historical relevance can be debated. I hope I made clear in the last post the great uncertainty surrounding any effort to extrapolate from such a small data set. On the other hand, we shouldn’t blind ourselves to the political reality of running for reelection when unemployment is among historically high post-war levels. Simply put, the economic fundamentals mean Obama is facing a difficult reelection challenge no matter which of the current Republican candidates he faces.
I’ve focused on very basic economic indicators here. Nonetheless, they do provide a good shorthand assessment of the fundamentals that drive elections. If I get the chance, however, I’ll present some additional economic indicators focusing on disposable income, and some more sophisticated analyses that have proved very useful in predicting past election outcomes.


