Why are President Obama’s approval ratings so low?
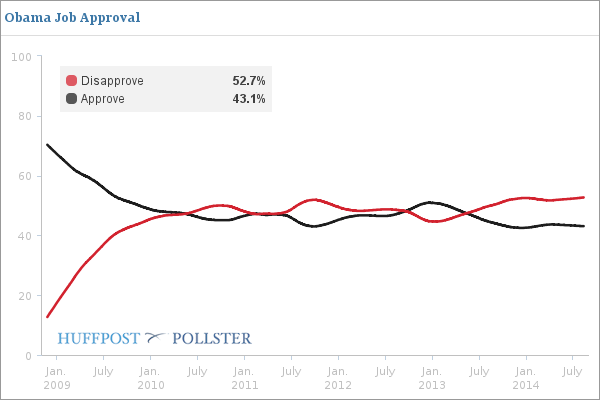
The latest aggregate polling at Pollster.com shows Obama’s approval rating at only 43% which, as the Pollster.com graph indicates, is pretty much right where it has been all this year. At RealClearPolitics, which uses a slightly different algorithm, Obama’s approval stands at 41%.
This is a puzzle, because as political scientist Seth Masket points out, the economy is actually improving, albeit not in historically robust fashion, and presidential approval ratings usually track economic performance. However, Obama does not seem to be reaping any reward in his approval ratings from an improving economy. Instead, his approval ratings appear stagnant. Why is this the case?
Masket rejects two frequently cited suspects: “First, let’s dismiss the simple answers: It’s not because of racism or polarization. Obama’s approval ratings have been very stable for most of his term, usually hovering within a few points of 45 percent. But he came into office with approval ratings near 70 percent, even though it’s hard to imagine any of the respondents not knowing his race. And the country wasn’t really much less polarized in 2009 than it is today.”
Instead the answer, Masket suggests, is that perceptions regarding the economy among those polled have yet to catch up with the reality of sustained growth: “Basically, because the good news is relatively new. The American economy is still emerging from the shadow of the worst crash since the Great Depression, and the recovery up until very recently has been rather paltry. Remember, GDP growth in the first quarter of this year was actually negative. And even consistently strong growth takes a while to affect voters’ impressions of the economy and the political system.”
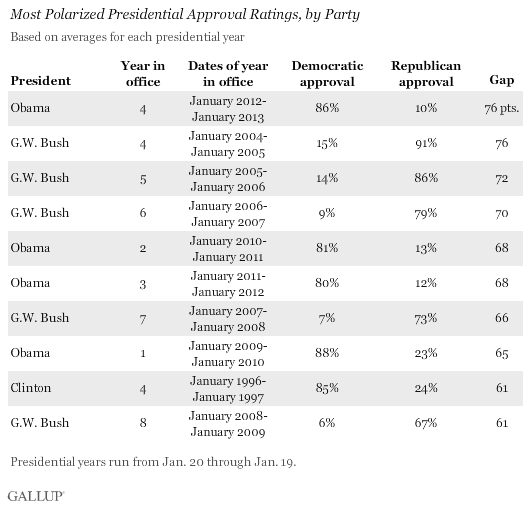
I think Masket is on to part of the explanation, but that there are additional factors at work that are deflating Obama’s support. Let us first consider the impact of polarization, or what is more properly described as party sorting. As the two parties have become more uniformly sorted by ideology – with liberals increasingly calling themselves Democrats, and conservatives identifying as Republican – presidential approval ratings are more likely to break down along partisan lines. In this respect, Obama’s partisan support in approval ratings is almost the mirror image of his Republican predecessor George W. Bush’s.

For Masket, however, party sorting can’t explain Obama’s persistently low ratings because, as the chart above shows, even as Republican support for Obama may fall, rising Democratic support should compensate. Moreover, the country is no better sorted now than it was when Obama had approval ratings hovering above 70%. However, this does not take into account shifting levels of approval among independents. As of today Obama’s approval among independents stands at 33%, a far cry from the 52% margin he won among this group in the 2008 election and even lower than the 45% support independents gave him in 2012. Moreover, polls show that the percent of people self-identifying as independents is growing, with more than 40% classifying themselves as independents at the start of this year compared to 35% when Obama took office.
To explain Obama’s drop in support among independents, it is worth thinking about the factors that influence approval ratings more generally. As I discuss in this previous post, Masket is correct that the economy is certainly a major influence. But two additional factors come into play. One is what I call a structural dynamic associated with the President’s time in office. For example, we know that all presidents start with artificially high approval ratings – the so-called “honeymoon” effect – in which even some who did not vote for the President nonetheless express initial approval of his performance. That explains the 70% approval rating Masket references in the first weeks of the Obama presidency. Invariably this level of support cannot be sustained as political reality sets in.
The second set of factors influencing a president’s approval ratings are significant events which often exert a short-term but measurable impact. For an extreme example, think of George W. Bush and his 90% approval rating after the 9-11 terrorist attacks. On a less extreme level, as Stu Rothenberg suggests, Obama’s approval rating may be suffering from the confluence of a recent series of negative events, particularly in foreign policy. These include the rise of the Islamic State in Iraq, the Israeli-Hamas conflict in Gaza and the ongoing civil war in the Ukraine, to name the most prominent. The reason Obama’s approval ratings continue to lag, I think, is because these foreign policy events have tended to overshadow the economy when it comes to evaluating his performance.
The result is that despite an economy that seems to be improving, Obama’s and Bush’s approval ratings are remarkably similar at the same point in their respective presidencies, as this chart put together by Tina Berger and Day Robins indicates. (Note: the x-axis denotes the number of days into the presidency.)
 This does not mean, however, that the two presidents’ approval ratings will continue operating under identical dynamics. Bush’s approval ratings had yet to be impacted by the Great Recession which officially kicked in during December 2007, and which contributed to the steady decline in his approval throughout his presidency. In the long run, if the economy continues its current incremental improvement I would not expect Obama’s approval to continue to track Bush’s decline. But that improvement may not come soon enough for Democrats. In this era of increasingly nationalized elections, midterms are in part viewed as a referendum on the president’s performance. To the extent this holds true this November, Obama’s middling approval ratings are not likely to boost his party’s electoral fortunes.

