This is the Excel document I created (with 8 Sheets) and referred to throughout the text:
data sheet #1 (.xls file)
¤
Lesson Plan: Cost-energy Savings Analysis of CFLs versus Incandescent Light Bulbs by Reading Electric Bills
Grade Level: 9th Grade (Freshman High School), 1st semester
Context: Electricity through Chemistry and Mathematics
Estimated time: 1×80 minutes
(NB: although the Stage 3 is essentially designed for one 80 minutes long classroom meeting, the lesson is flexible and easy to be modified so that 2×40 minutes long sessions take place)
¤
| BIG IDEA: In order to completely understand comparative cost-energy savings analysis of CFLs versus incandescent light bulbs, students will first learn how to read electrical bills and how to record the data in graphs using Excel. Then they will work with more variables on the same graph, seeing direct and indirect changes of power usage.
|
¤
|
STAGE ONE: DESIRED RESULTS
|
|
|
ESTABLISHED GOALS: This lesson comes right after the Day C when students learn to read electrical bills. Now they will be able to work with data from multiple bills and think about direct and indirect changes of power usage. By comparing data for relatively same households with incandescent ligt bulbs and those with CFL, the students will see an illustration why a certain type of light bulbs is better. The following lesson would then explore that information into depth using chemical structure of the bulbs. For now, the state standards of Vermont DoE are a previous one (7.10.-30) with a new one that is more stressed throughout this lesson (7.9-23). Both of them are listed below:
MHS: 23 Interprets a given representation(s) (box-and-whisker or scatter plots, histograms, frequency charts) to make observations, to answer questions or justify conclusions, to make predictions, or to solve problems.
MHS: 30 Demonstrate understanding of mathematical problem solving[2] and communication by:[4] • Approach and Reasoning—The strategies and skills used to solve the problem, and the reasoning that supports the approach; • Execution—The answer and the mathematical work that supports it; • Observations and Extensions—Demonstration of observation, connections, application, extensions, and generalizations; • Mathematical Communication—The use of mathematical vocabulary and representation to communicate the solution; and • Presentation—Effective communication of how the problem was solved, and of the reasoning used. [2] Problem-solving situations are mathematical problems that reflect the levels of mathematic in the Grade Level Expectations. [4] See Vermont High School Level Mathematics Portfolio Scoring Guide for additional information.
|
|
|
UNDERSTANDINGS: . -power usage and its costs fluctuate throughout the year -they are directly and indirectly dependent to some variables, such as average temperature or a specific devices used in a household -adding more variables to the same graph will help us to explore those relationships |
ESSENTIAL QUESTIONS: . Can we gather more data about monthly electric usage and costs? Can we plot them into one graph? What type of a graph is the most appropriate? Is the shape of the graph constant? |
|
KNOWLEDGE: . -histograms are the most appropriate type for plotting graphs that relate a variable of the change of time -internet can help us to find general data, such as average monthly weather temperature -CFL use less electrical power (commonly said “use less energy”) as can be illustrated by the graphs occurring in the whole class -the reason for that is that they have smaller internal resistance making the total resistance (R=V/I) in a circuit smaller, thus decreasing the total power P=VI=I2R for the same current I |
SKILLS: . By the end of this lesson, students should clearly understand why CFL have smaller power usage using mathematical reasoning of the physical concept of the Ohm’s Law. They might not necessarily have a comprehensive reasoning (yet) why the initial assumption of smaller internal resistance is true (that would be covered in the next lesson). Also, students should have gained fair skills of data analysis on graphs and relating different variables to each other. As mentioned in the Knowledge section, internet use is also explored in this lesson. Searching a search engine for e.g. “average temperature Vermont” immediately gives us demanded results that could be found at various web-pages (e.g. http://countrystudies.us/united-states/weather/vermont/ having average high, average low and mean temperature). |
|
COMMON MISCONCEPTIONS: . Some students may think that less electricity is consumed during warm summers comparing to cold winters due to the fact that no heating is necessary. That would be true only if a household did not use AC. On the other hand, in fact, most of the households have the highest (or comparable) energy usage during summers. That is due to cooling necessity. Also, some may think that keeping windows opened during summers would create a drift and help to cool a room down. That is not true again. Doing so only diminishes the effects of AC, letting the cooler air to escape out, making more warm air to cool down and so increasing the total energy use. |
ESSENTIAL VOCABULARY: . – prior vocabulary: voltage current resistance, resistor power Ohm´s Law battery EMF Circuit CFL (compact fluorescent lamp) light bulb – histogram – dependent variables – average, mean |
¤
|
STAGE TWO: ASSESSMENT EVIDENCE
|
|
| PERFORMANCE TASK (S): (STUDENTS DEMONSTRATE BY SATISFACTORY, INDEPENDENT)
. -Students work through the following data sheet Data Sheet 1 using an Excel software and submit it on the end of the lesson for evaluation (there are 8 sheets, each of them worth 5 points – 2 for the data and 3 for a conclusion about appropriateness and possible improvement) -sheets one through four simply compare different types of graphs and why we could (or could not) use them -sheets five through eight explore how adding a new variable changes our thoughts; it also shows how graphs can be adjusted in order to best illustrate our point |
OTHER EVIDENCE: (FORMATIVE, SELF-ASSESSMENT)
. -ongoing classroom evaluation based on student reactions, questions and answers -participation and reactions of students to brainstorming discussion present throughout the whole lesson |
| KEY CRITERIA:
.
Can students easily read and interpret data in order to prove their point? Have the students shown any progress and development of their ideas? Are they aware of misconceptions outlined in the Misconceptions section? Are the students doing their tasks responsibly and actively participating in the class? Can they argue for their point (no matter whether it is right or wrong) using appropriate language, i.e. a language of the discourse group? Do students have fun, enjoy the class and are they engaged? |
|
¤
|
STAGE THREE: LEARNING PLAN (LESSON SEQUENCE + LEARNING ACTIVITIES, “WHERETO”)
|
| CLASS # 1: (Days/classroom periods __1×80min__ ) Prior knowledge, Introduction, Consolidation, Assessment:
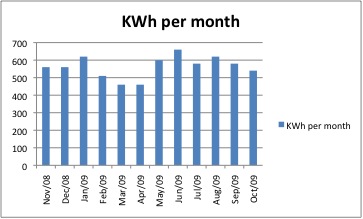
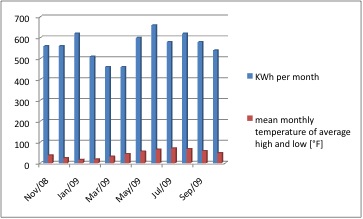
. Before this lesson took place (see Day C), students were asked to bring the data for total energy usage, preferably the one from their own households so that they could relate to it. The first 20 minutes would be spent by getting familiar with Excel interface and working on the sheet one. The Sheet 1 would have this kind of a graph:
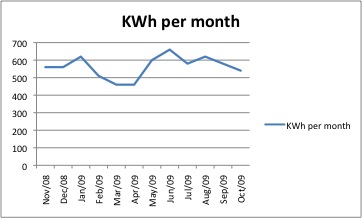
At the same time, a comprehensive discussion about the reasons why the total energy use fluctuates. Ideas of other factors such as weather temperature should be welcomed and left open ended. Also, suggestions for other types of graphs should be welcomed and accommodated during the next 15 minutes. Assuming that the Sheet 1 was “appropriate use of a graph”, students should discuss and find out on at least three other sheets (i.e. Sheets 2, 3, 4) that, for example – Sheet 2 “could also be used but we cannot read the specific values that well”:
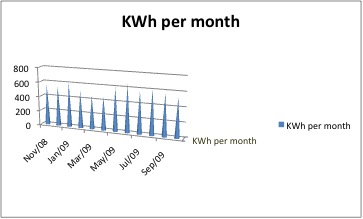
Sheet 3 is “pretty but inappropriate because of the lack of variation – the shar tips seem not to be have too much of a difference one from another”:
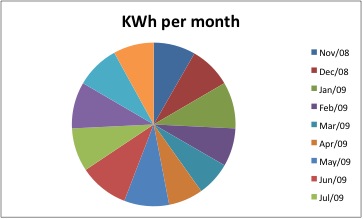
Sheet 4 is “not helpful at all”:
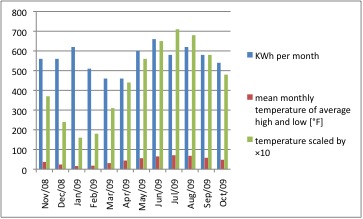
Of course, students would work individually in their own work sheets while they could discuss their thoughs out loud. Each graph should be done individually and so the students would not be presented any specific examples from the teacher. Afterwards, an accomodation of the temperature idea should take place. I expect another 15 minutes on this. Gathering the most appropriate date is an issue as well and therefore the students would explore various interenet sources using search engines. Hopefully, some of them will stumble across monthly data for “mean temperature of average high and average low temperature” e.g. at (http://countrystudies.us/united-states/weather/vermont/). They would enter these data into a new column on a new Sheet 5 and get:
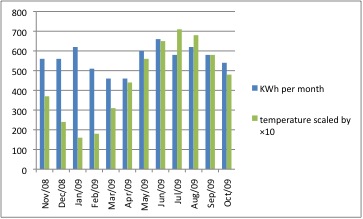
Immediately, they should think “good, but the mean temperature is too low – can we scale it?”. Therefore they will be introduced to function language in Excel and why it is so easy to be used. The good point is that as soon as the function is defined as a cell times a constant, then the cell below will be multiplied by the same constant as well. For example, if “D2=C2*10”, then “D3=C3*10”. Adding a new variable should help. So students should conclude something in the sense that “scaling helps, but now there are too many variables – let´s edit it”:
Another 10 minutes would be spent on the Sheets 7 and 8. There students should work through an understanding that:
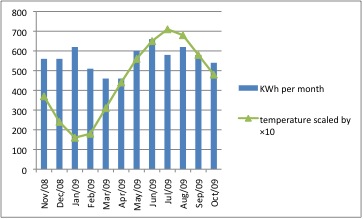
“looks great now, but what else can be done”? They can certainly combine their skills of Excel and compile a line graph and a histogram:
My conclusion in Excel worksheet Sheet 8 is “yes, that´s it – combining both types of graphs gives us a nice example that the relation of average temperature and energy usage is not direct; why?” and students should think more-less of the same. Why is that? The last 20 minutes would be spent with a discussion again where the students would explore the misconceptions (see Misconception section) and share other ideas of lowering total energy usage. Some students may suggest CFLs and at that moment the teacher should encourage the student to share the data which could be compared with a comparable household of some other student not using CFLs. Adding those two would show a direct relationship in this case – the number of CFLs at home directly affects the total energy usage. Again, the question should be “why?” and therefore the students would draw back on their knowledge about the Ohm’s Law and figure out (either by discussing or with teacher’s help) that the internal resistance R is lower, making the total resistance (R=V/I) in a circuit smaller, thus decreasing the total power P=VI=I2R for the same current I. For once again, wondering “why?” it is so shall move us onto the next lesson where students would learn the chemical structures of CFLs and incandescent light bulbs. If there is time, the students could compute internal resistances of usual spiral CFLs and incandescent light bulbs. Again, they may search internet to find their respective power usages, or they can believe that it is 13W and 60W respectively. Also, further computational thoughts could be that saving 47W per hour makes 47Wh and using that light for 4h during 30 days makes 4×30×47 = 5640Wh. That is 11.3KWh for just two light bulbs of that kind, summing up to total year savings of 12×11.3 = 135.6KWh. And if you have let´s say 5 of those light bulbs, it should save you around 5/2×135.6 = 339KWh a year. If the price is still around 0.123$ per KWh, then the savings are 0.123×339 = 41.7$. And that´s only if the 5 lights are lit for 4h a day… |
¤
Throughout this lesson plan, I tried to give students enough freedom to explore their own ideas about energy conservation, while guiding them to certain discoveries. Although some of the initial thoughts, such as the weather temperature relation, are not valid, they still provide us with additional knowledge and hints about energy conservation.
Apparently, a media lab with computers would have to be booked in advance for this lesson. I tried to present and extensive use of technology in this lesson that is, however, quite advanced but simple to work with at the same time. No previous skills in Excel are necessary. I believe that gaining skills to work with such software and analyze the data is necessary in order to support certain points in scientific papers. The students will write such essay on the end of the unit and they would be expected to include similar graphs.
Also, continuous discussion form assures that students are engaged and they can express their opinions in front of the whole class. Of course, they will be encouraged to speak using the vocabulary they have had learnt (discourse language). This will slowly help them to prepare for the final assignment already mentioned.
In case of students having problems to advance through certain sections of this lesson, the teacher is encouraged to help on individual basis because no constant lecturing/speaking is required. I hope I made it clear that, in this class, the students explore the forms of their cognitive thinking on their own , while the teacher participates in the discussion as an equal member who knows a little bit more and therefore can tailor them to proper understanding of concepts.
Lastly to mention, this lesson is very flexible and has a few more activities (calculations) that may be omitted and no major difference in students’ understandings would occur. I, however, encourage to work through those numerical examples that are very simple and, by now, the students should manage to do them on their own. Therefore, if time does not allow, I would give that to the students as homework.