
After a period of post-midterm decompression, it’s time to return to the blogging salt mines. Picking up where I left off in my last post, let me start with a simple question: why did every political science forecast of the midterm election of which I am aware underestimate the size of the Republican wave that hit the House (the few that predicted Senate results were off as well)? To be sure, the results did fall within the confidence interval of some of the models, and most political scientists foresaw the Republican House takeover, but none of the predicted point estimates came very close to the final results. As of today, it looks like Republicans picked up about 62 House seats (four races are still pending) and 6 Senate seats. To refresh your memory, here’s John Sides’ chart with the Labor Day political science projections.
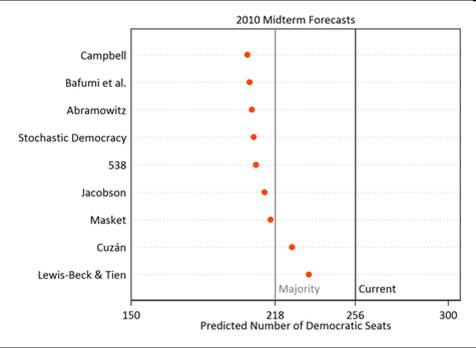
So, the most pessimistic forecast from the Democrats’ perspective – Campbell’s – still had Democrats holding more than 200 seats, or a dozen more than the actual 190 they now possess (with four races pending). Note that even with the advantage of several additional weeks of data, I didn’t fare much better; my “tweaking” of the projection models led me to forecast a 49-seat Republican pickup, considerably short of their actual gain.
In addition to the thrill of giving out Presidential Power t-shirts (yes, I will announce the contest winners in a separate post), the reason why I am interested in these forecasts is because they are a measure of how well political scientists understand midterm elections. Unlike someone like Nate Silver, we aren’t only interested in getting the final numbers right – instead, we want to understand what explains those results. (By the way, Silver’s prediction – he’s “538” in the chart – as of Labor Day fell, as you can see, in the middle of the pack. That’s not too shabby – for an economist!)
What most interests me about this last midterm is not that the forecast models were off – it’s that they were all off in the same direction. Political scientists systematically underestimated the Republican seat gain. In one respect, of course, this is perhaps not surprising; as I noted in several of my pre-election posts, political scientists are inherently conservative folk. They tend to assume that future iterations of an event will unfold much as it did previously, so prior patterns should be a reasonably reliable predictor of what’s to come. Evidently, this assumption did not hold true for this latest midterm. But why not? I can think of four related answers: the unprecedented depth of the economic recession, the nationalization of midterm elections, the role of the Tea Party and the collective impact of the controversial legislation – particularly TARP, the stimulus bill and health insurance – passed by the Democratically-controlled Congress during the last four years. Let me start by exploring a couple of these factors: the economy and the nationalization of elections. I’ll deal with the Tea Party and the controversial votes issues in a separate post.
As I’ve explained in previous posts, most forecast models incorporate some measure of the economy, such as quarterly growth in GDP or disposable income, or changes in the unemployment rate. As my colleague Bert Johnson surmised during our election night coverage, it is possible that forecast models constructed from previous years’ economic data may have underestimated the relative importance of the current economic downturn to voters. In other words, models based on “normal” economic conditions may not do particularly well when the economy is an historical outlier, as this one certainly is. Consider that during the last six decades, as this charts shows, monthly unemployment levels have only approached the current rate once before, during Reagan’s first term.
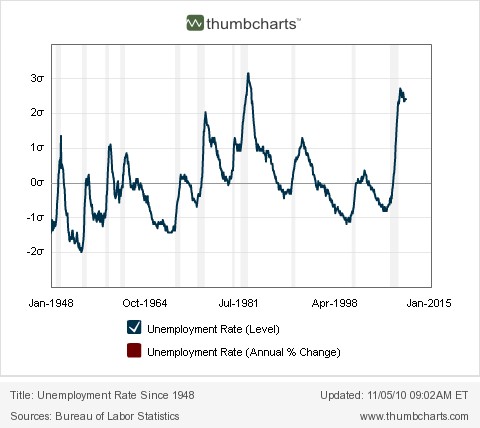
During the 1982 midterm, of course, Reagan’s Republican Party only controlled the Senate, not the House; the divided government may have prevented voters from holding Reagan and the Republicans solely accountable for the dismal economy in that election which may partly explain why Republicans only lost 26 House seats. (Note that they also had fewer House seats to lose.) In 2010, by contrast, Democrats controlled all three branches and thus were more likely to suffer retribution from voters concerned about persistently high unemployment.
Of course, unemployment is only one facet of how voters’ assess the economy, and the economy is not all they assess during midterms. Nonetheless, it is an important component – perhaps the most important component that goes into a voter’s calculus. Now add to the mix concern over record post-war budget deficits, spending on TARP and the stimulus, uncertainly about health care costs and you have the setting for a midterm election driven to a much greater degree than in previous years by economic worries. Moreover, as I’ve noted in previous posts and as this table shows, House elections have become increasingly nationalized since the mid-1980’s.
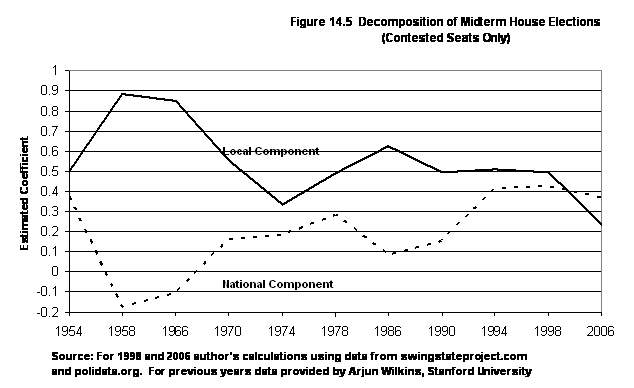
This means individual House races are more likely to be influenced by factors outside each district – factors less amenable to individual candidate’s control. I’m currently putting together the numbers for the 2010 midterm, but I have no reason to believe it was any less nationalized than recent midterms. That means the impact of economic factors was likely even greater during this last election cycle.
My point is not that the forecast models totally ignored economic factors – it’s that economic factors weighed more heavily in midterm voters’ minds this time around than is typically the case. With Democrats viewed as the party in charge, and with Democrats holding more vulnerable seats, they were extremely susceptible to getting washed out of office in a “wave” election. To capitalize on these conditions, Republicans needed to both run good candidates and to get voters to show up at the polls. As it happened, the Tea Party stepped in to assist with both conditions. I’ll address that topic in the next post.
Addendum: The initial post showed the wrong unemployment data – I’ve corrected it above.