Category Archives: Political Parties

The Times, We Are Campaigning! (Starting With Biden)

Those readers familiar with my 2016 election coverage remember that I strongly believe that to fully understand a presidential candidate, it is necessary to see them in their natural environment: on the campaign trail, speaking to, and with, voters.   Without attending the rallies, it is easy to let prior assumptions drive election analysis, as happened to me when I initially failed to understand the scope of and reasons for Trump’s support, and instead was too quick to write off his presidential candidacy.  (For my analysis of what I saw and heard at his campaign rallies, see here). Direct observation also helps sidestep the influence of a media that is often too eager to fit a campaign event into an existing narrative that may not fully capture what actually occurred.

With that in mind, and given that the “invisible” primary has become slightly more visible (thanks to the first set of debates (see my debate analysis here), once again I’ve begun my quadrennial madness, dashing from campaign event to campaign event in order to give you an unvarnished (as much as possible) ringside seat for what is shaping up to be another fascinating, and portentous, election.  My initial focus will be on the Democrats’ side of the nominating process, since that is where the action is.  We begin with my visit to a Biden campaign event in New Hampshire, once of several he held in the Granite state yesterday.  Biden, of course, was coming off a subpar debate performance two weeks ago highlighted by his exchange with Senator Kamala Harris regarding mandatory busing to integrate public schools – an exchange that, as replayed by the media, likely contributed to a post-debate erosion in Biden’s polling support.  Much of the polling support Biden lost appeared to move to Harris, as she saw her polling numbers increase by about 8%, pushing her into a virtual tie for second in national polls, with Sanders and Warren.

RealClearPolitics Polling Averages

So, I was eager to see how Biden would respond in the aftermath of the debate.  Would he continue to position himself as a front runner, focusing primarily on his ability to beat Trump?  Or would he respond to the attacks by his Democrat rivals?  As it turned out, he did a little of both.  (As always, in writing these posts I am relying on contemporaneous tweets send out by me during the event, notes taken by my fellow campaign analyst and wife Alison, and my increasingly faulty memory.  All references to statements by others are paraphrased, unless in quotation marks.)

We arrived at Mack’s Apples, a picturesque little farmer’s market in Londonderry, just as Biden launched into his speech.  Although Biden was speaking from inside a small barn, most of the 300 or so people attending (but not the media) were outside, trying to stay cool on an extremely hot day. 

Inside The “Barn”

Biden prefaced his talk by saying he was in the race for three reasons: health care, climate change, and to bring the nation together. We did not hear Biden mention his Democrat rivals by name, but it was clear they were on his mind when he launched into a strong defense of the Affordable Care Act, arguably Obama’s signature domestic achievement, saying he would oppose any effort to replace it.  In a not-so-slightly veiled barb at his opponents who are pushing to supplant the ACA with some version of Medicare-For-All, Biden argued instead for strengthening and extending the existing health care legislation, in part by adding a public option, which he sees as both a less expensive and more politically feasible approach.  He also sought to link health care to criminal justice reform by emphasizing the importance of drug treatment as an alternative to incarceration for addiction.

He then turned to climate change, saying everything else pales in comparison.  He promised that the first act of the Biden presidency would be to rejoin the Paris climate accord, which generated strong applause from the audience. He noted that although the U.S. contributes 15% of global carbon emissions, it should use its position of influence to work with other nations to reduce overall emissions.  Trump, he argued, hurt this effort by isolating the U.S. and damaging relations with our allies – a pattern Biden pledged to reverse, citing his extensive experience on the Senate Foreign Relations committee. He also pointed out that there were immediate steps the country could take to curb emissions, such as increasing the number of charging stations for electric cars.  

Biden’s final point centered on an issue that has gotten him into difficulties with some of his opponents: the need to work with political opponents to get things done, which he sees as crucial to bringing the nation together. The President, he said – using language drawn straight from Richard Neustadt’s classic work Presidential Power “must be able to persuade.”   (At this point I tweeted that he had already earned my vote simply by quoting my dissertation adviser! – if I voted. Which I don’t.)  He defended the need for political pragmatism and pointed out that it was that focus on reaching across the aisle for support that led to Democrats’ victories in predominantly red states in the 2018 midterm elections.  He also made a plea to the millennial voters, arguing that they could have a transformative impact if they voted at the same rates as everyone else.  

Biden finished on a rhetorical high note by trying to draw contrasts with Trump and his political supporters. “We are for hope, they are for fear,” he roared, “We are for unity, they are for division” and finishing with “We are for truth, they are for lies!”   The music kicked in, and he waded into the small crowd in the barn to meet and greet, followed by a line for those seeking selfies with the candidate.

Biden Meeting and Greeting

Biden took no questions, and in total his talk lasted perhaps 15 minutes. This was a quick campaign stop wedged in among longer events he held in other spots in NH that day. In that time, however, it was clear that he was not apologizing for some of the stances for which he has been criticized, particularly his effort to position himself as the candidate best able to get things done, even if it means working with political rivals, and as someone with a voting record that supports that contention.  His tone was feisty, as he doubled down on what seems to be the core of his candidacy: that he has the best chance to beat Trump – a point reiterated by an older man when I asked him what he thought about Biden’s speech.  “It was great.” he said.  “He’s the only one who can beat Trump.”  “Well, that’s what he said,” I responded.  “He’s right,” the man replied.

It remains unclear whether Joe will get the chance to prove that claim, or whether Democrats will view him as too old, and too willing to compromise core Democrat principles as articulated by the more progressive wing of the party.  On the surface he remains as folksy and confident as ever, continuing to banter with the crowd from his SUV as he left the event. Meanwhile, we headed north to see Beto O’Rourke in action.  It was an entirely different campaign experience – one I’ll post about tomorrow.

Biden Has Left the Building!

How Do Americans Like Their Policies? In Moderation, Please.

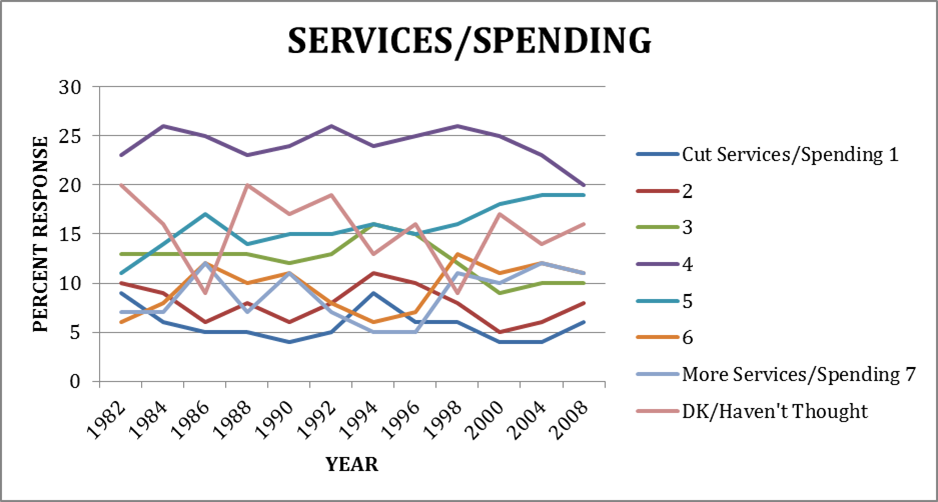
In Monday’s post I took issue with Vox founder Ezra Klein’s claim that, in his words “the idea of the moderate middle is bullsh*t.”  You will recall that Ezra argues that indexes purporting to show the existence of a moderate middle are misleading, because they are often amalgams of ideologically extreme opinions. But we don’t need to rely on indexes as evidence that many Americans have moderate policy views – we can look at their responses to specific survey questions. The American National Election Studies (ANES) researchers have been asking Americans about their opinions on issues for several decades now. Typically the question starts by giving the respondent two policy extremes and then asks her to place herself somewhere on a 7-point scale anchored at either end by the extreme responses. As an example, here is a question asking individuals their views regarding government spending on services: “Some people think the government should provide fewer services, even in areas such as health and education, in order to reduce spending. Other people feel that it is important for the government to provide many more services even if it means an increase in spending. Where would you place yourself on this scale, or haven’t you thought much about this?”

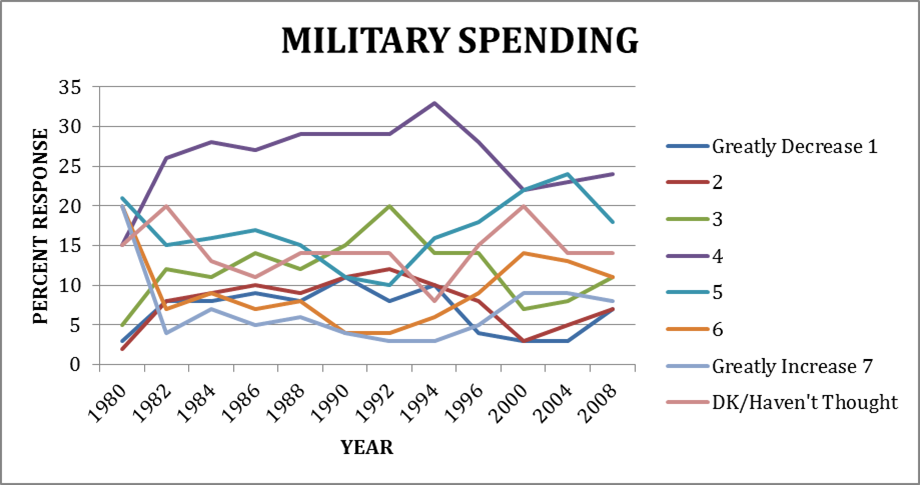
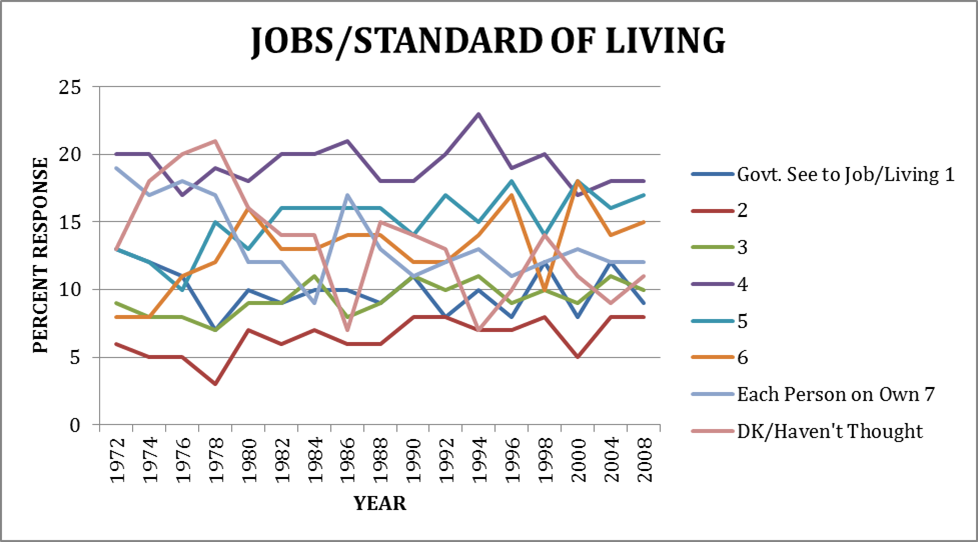
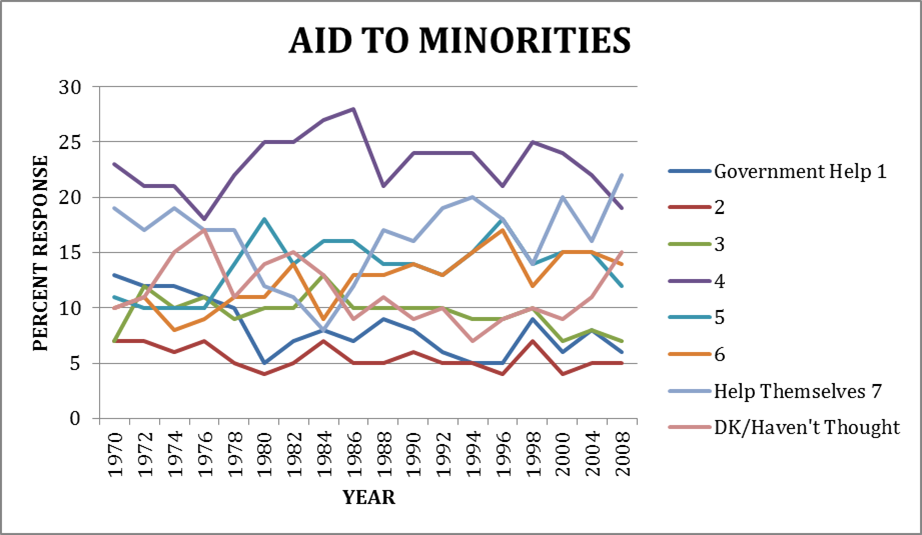
Day Robins tabulated the responses to five of those questions for which we have data across time, including the government spending/services question. In each case the moderate, or middle response (Option 4) is typically the modal response, or close to it, across the entire survey history. (Note: although researchers often group the “don’t know/haven’t thought about it” bottom response with the moderate/middle answer, Day has not done so here. So the charts below likely understate the number of respondents adopting the moderate position.)

Here’s the government spending/services time trend.

gov services.16

As you can see, even without including the “don’t knows” the most frequent response across a quarter century has been the middle, moderate choice. (The second most frequent response in recent years is 5.) For the most part, we see the same general pattern on the other four questions Day has graphed; the moderate position is typically the modal response. Here’s the graph of responses regarding whether to increase military spending.

military spending.16

Here’s one asking about government creation of jobs.

jobs.16
This one addresses aid to minorities. For most of the time period the moderate position holds sway, although in 2008 it is slightly eclipsed by option 7 “Help themselves”.

aid to minorities.16
Finally, here’s one measuring support for government health insurance. Here option 1 – strong support for government health insurance is marginally preferred to the moderate position in the 2008 survey. But note that support for the moderate position has actually been increasing, while option 7 – private coverage – has lost support.

health insurance.16
Now, before Max Kagan jumps all over me, these graphs are not evidence that most Americans are moderates across all issue areas. In fact, it is quite possible that their views vary depending on the issue. But the graphs do suggest that for most of the time on each of these issues, a plurality of Americans stake out a moderate position, with the exception of whether the government should provide health insurance and, in 2008, aid to minorities. And this is without including the “don’t knows/haven’t thought about it” response with the moderate answers. If we lump those in, as Abrams and Fiorina do for the 2012 responses to these questions, the moderate views appears even more popular.

Fiorina 3 moderatesMoreover, on three of these issues across most of the time period  – government services, jobs, and military spending – the responses are normally distributed, with most responses clustered around the center of the ideological spectrum, similar to what the Abrams/Fiorina graph shows for 2012. The government health insurance answers skew slightly liberal, and the aid to minorities responses are weighted more to the conservative side of the response distribution.  If Americans were becoming more polarized, we might expect to see a decrease in the number of Americans adopting a centrist position, and increases in those choosing more extreme positions, on these issues.  On the other hand, if what most pundits describe as ideological polarization is really party sorting, then I think we’d be more likely to see the graphs that Day has compiled.

Yes, at the individual level many Americans hold contradictory and sometimes extreme positions. But many hold moderate views too. And, in the aggregate, at least on these five issues, most respondents across much of the last quarter century cluster at or near the middle of the ideological spectrum. Yes there is some movement across responses categories.  But it is hardly enough to lend credence to the notion that the moderate middle is a myth.  And it is consistent with the notion that there has been no significant growth in ideological polarization.

The Myth of the Myth of the Moderate Middle

Vox founder Ezra Klein posted this diatribe last week explaining why he believes “moderate voters are a myth” that was extreme even by Ezra’s standards. Drawing on this draft paper by Douglas Ahler and David Broockman, Klein argues that the notion of moderate voters is a statistical artifact that occurs when researchers aggregate responses to several survey questions into a single ideological scale. So, greatly simplified, the idea is that if an individual gives a very conservative answer to one question, and a very liberal one to another, the “index” based on these responses might classify her as a “moderate” by, in effect, balancing the two extreme responses. But in fact all the survey responses show is that she has diverse but extreme opinions – not moderate ones.

In principle, Klein’s criticism is correct. Indeed, scholars have long been aware of this problem when it comes to creating indexes of ideology. Note, however, that it is not only a problem with indexes that purport to show that voters are mostly moderate – other indexes professing to show that Americans are becoming more polarized also suffer from similar coding issues. (In this vein, see this Fiorina, Abrams and Pope’s critique of this Abramowitz/Saunders article on ideological realignment in the United States. Their essential point is that slight movement in responses to one question can, depending on coding, make it appear that voters are changing positions from moderate to extreme on an ideological index .)

Had Ezra stopped there with a caution to be careful about interpreting indexes that purport to measure ideology, I would have been happy. But he doesn’t.  Instead, Ezra goes on to dismiss the idea of a moderate middle entirely: “The deeper point here is that the idea of the moderate middle is bullsh*t: it’s a rhetorical device meant to marginalize some policy positions at the expense of others. There’s no actual way to measure it, or consistent definition animating it, and it doesn’t spontaneously emerge in any of the data.”

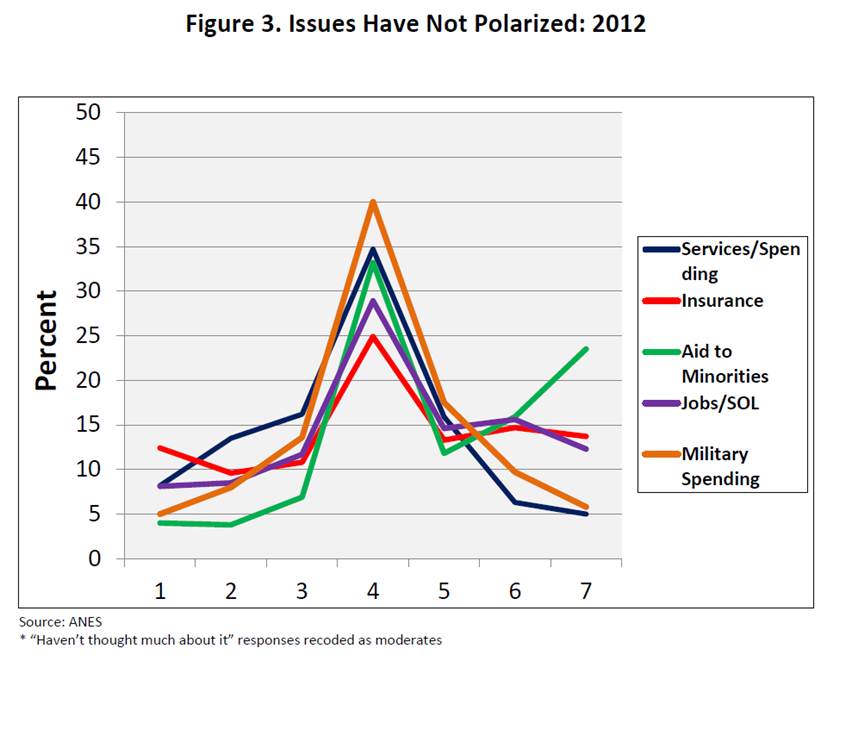
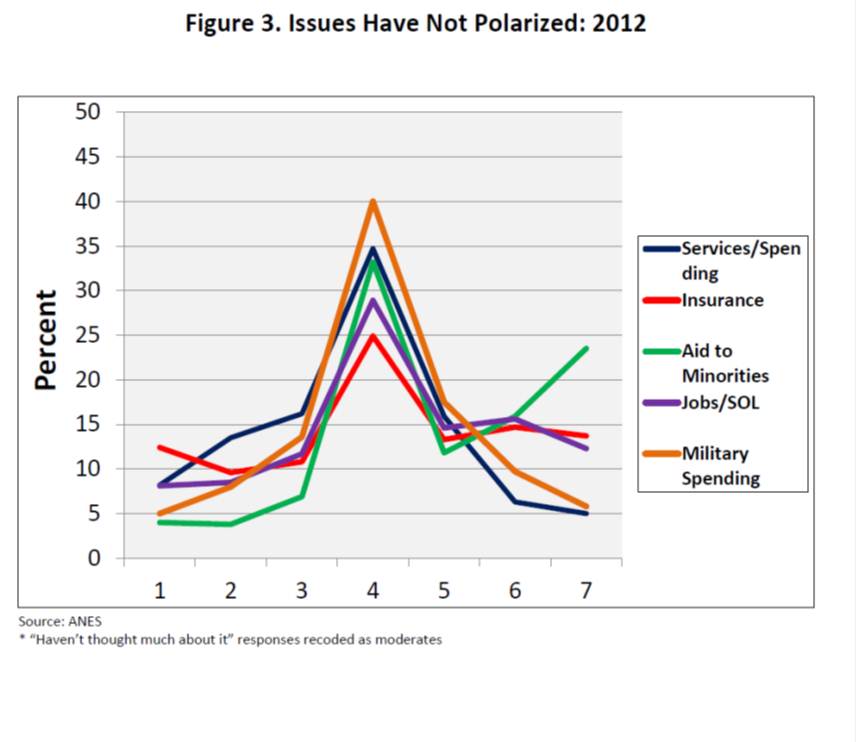
I’ll have more to say about the Ahler/Broockman paper in another post. (By way of preview, I think their findings actually support the notion of a moderate middle.) But the notion that the existence of a moderate middle is “bullsh*t”, to use a scientific term is, well, cow dung. Even if many Americans hold inconsistent views, and thus it is hard to classify them ideologically does not mean that on most issues the preferred position among Americans is an ideologically extreme one. Consider, for example, this analysis by Abrams and Fiorina regarding the distribution of responses from 1 to 7 to five policy questions asked by the American National Election Studies in 2012.  (Typically, the questions lay out two alternative policy positions on an issue, such as whether the government should or should not make an effort to help the social and economic standing of African-Americans, and asks respondents to place themselves on a 7-point scale in terms of where they stand on the issue.  Position 4 is the most moderate one, with 1 and 7 holding down the extremes.)

Fiorina partisan nonchange.emfAs you can see, the modal response to questions asking where the respondent stands is the moderate one on all five issue areas. (Note: the authors code the “don’t know/haven’t thought about it” as a moderate response based in part on comparing responses with other surveys that do not include these response options, and finding little difference in the distributions of responses.) Nor is this unique to 2012. Day Robins went back and looked at responses to these questions through several decades and found that for almost every survey the modal response on these five issues is the middle, or moderate, one.  I’ll show some of this data in graphical form in a separate post.

This is not the same as showing that at the individual level voters are mostly moderate, of course. It could be that different moderate coalitions consisting of different individuals show up on each issue. On the other hand, it doesn’t justify dismissing the idea of a moderate middle either, at least when it comes to choosing policy options in a number of issue areas. As Philip Bump reminds us, we need to be careful when we adopt short-hand language for any concept. But while Klein is right to point out the dangers of creating indexes to measure ideology, when it comes to the American voter I’m not ready to throw out the concept of a moderate middle in its entirety. That would be too extreme.

Sorted, Not Polarized: Why The Distinction Matters

When it comes to writing about polarization in American, who can blame journalists for expressing confusion? The Washington Post’s Dan Balz is the latest reporter to grapple with conflicting evidence and, perhaps more importantly, conflicting interpretation of the evidence by political scientists. In this recent article Balz discusses the results of a new study conducted by the Program for Consultation at the University of Maryland that shows there is little difference in the policy views of citizens in “red” and “blue” congressional districts.  (Their findings mirror those of Fiorina, Abrams and Pope in their Culture Wars?) In the same article, however, Balz also quotes political scientist Alan Abramowitz’s take on other data that Abramowitz suggests shows Americans are in fact deeply polarized.

But it is not just the conflicting interpretation of data that journalists must deal with – it is also the loose use of the term polarization itself that contributes to the problem. In common usage, polarization refers to the divergence of political attitudes toward ideological extremes, or a sharp division of a population or group into opposing factions. Understandably, when stories proclaim that Americans’ political views are increasingly polarized, most readers believe this means Americans must be dividing into two camps based on increasingly divergent political views. So, we must be seeing an increase in conservatives and in liberals, and a decrease in those holding more centrist views. (And, in fact, this seems to be what Professor Abramowitz, among others, believes is happening.)

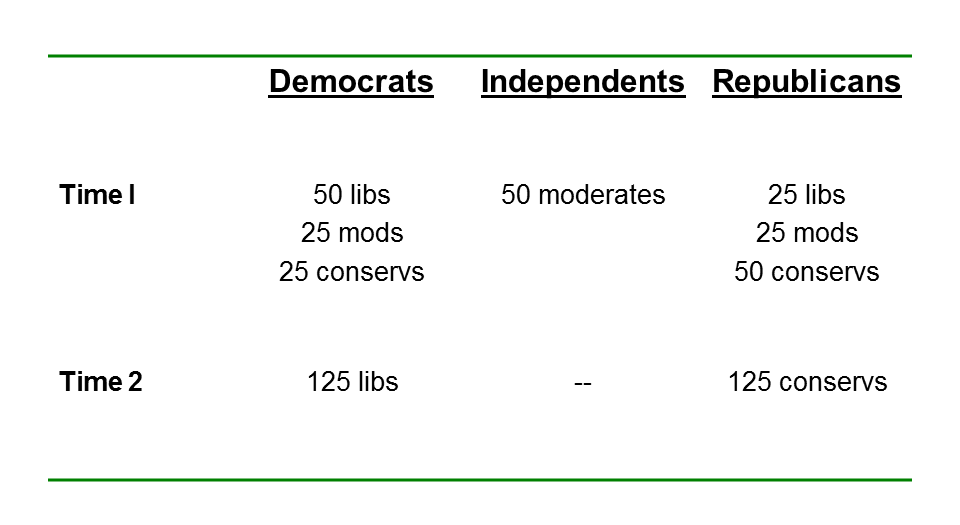
However, as I have discussed in several posts, most of the evidence used to support this claim does not show a process of polarization, as commonly understood. Instead, it shows a process of party sorting. To understand the difference, consider these two graphs taken from a recent paper by Sam Abrams and Mo Fiorina that discusses polarization and sorting. This first graph illustrates what most people think of when they hear the term political polarization. It shows the elimination from Time 1 to Time 2 in the number of moderates, as well as non-liberals in the Democratic Party and non-conservatives in the Republican Party. The end result is an increase in the number of liberals and conservatives, and the disappearance of moderates, consistent with what many people understand polarization to mean.

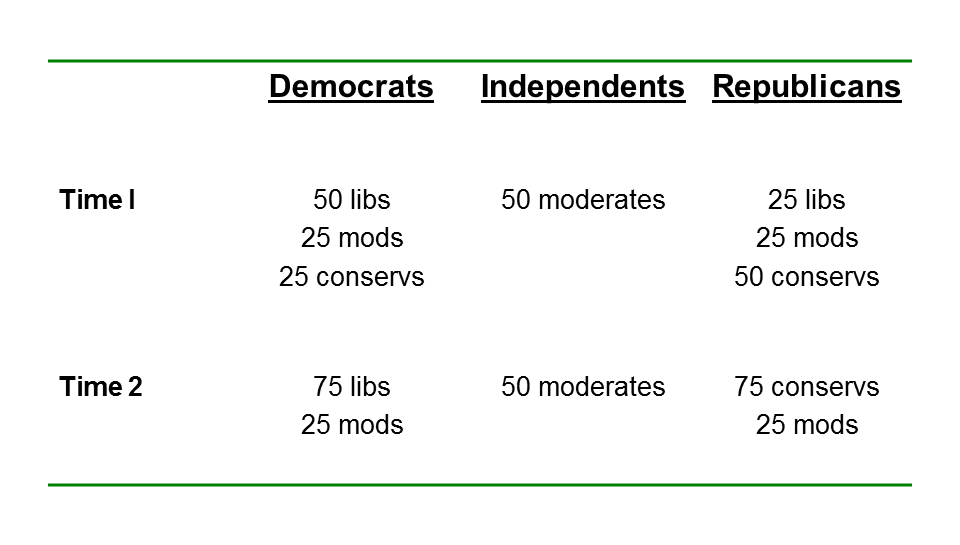
Fiorina polarizationNow, consider graph 2. Here the total number of moderates does not change from Time 1 to Time 2, but both parties purge themselves (through conversion and migration) of most of those who are out of step with the party’s dominant ideology (although some moderate leaners remain in each party). However, there is no increase in the total number of liberals or conservatives – indeed, in the aggregate, the distribution of political ideology hasn’t changed at all. All that has occurred is a better sorting of party affiliation with ideology, so that the Democratic Party has become more uniformly liberal and the Republican more uniformly conservative.

Fiorina party sorting

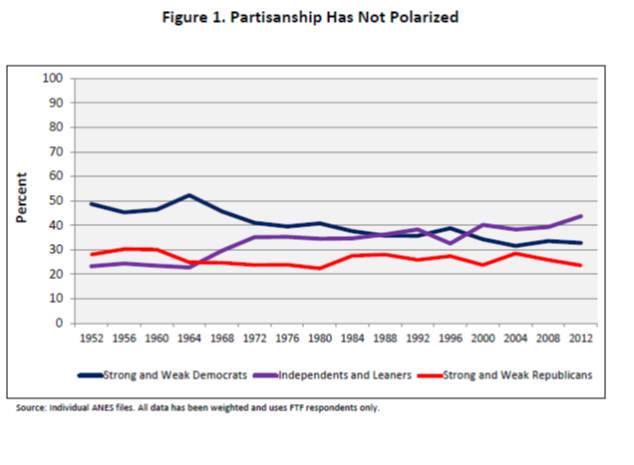
Which is more consistent with what has actually happened in the United States? You decide. Here is a chart, again from Abrams and Fiorina, showing the change in the distribution of partisan affiliation, based on American National Election Studies surveys,  since 1952. As you can see, if there is any long-term movement, it is in the slight increase in the number of self-described independents and those leaning independent.

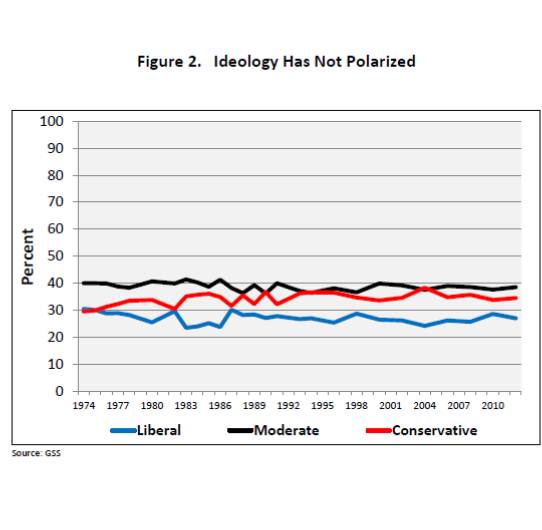
PartisanstableHow about changes in ideology over time? Again, as the following chart shows, we see very little movement in those calling themselves liberals, moderates and conservatives.

ideologystableBoth sets of data, then, are consistent with what Fiorina (and others) have described as party sorting, rather than political polarization. Nonetheless, some colleagues in the profession suggest that party sorting is itself simply another version of polarization. The argument is that even if the parties, or the number of liberals and conservatives, have not grown larger at the expense of the moderate middle, the center of ideological gravity in each party has certainly shifted toward the extremes. So we have seen a process of partisan polarization, albeit not the kind that comports with what many laypeople understand polarization to mean.

I am uncomfortable with this broader use of the term polarization for several reasons. First, most laypeople, including journalists, don’t always appreciate the differences in the two processes – when they see the phrase polarization, they assume it means a general movement within the public toward the ideological extremes at the expense of the center. (It doesn’t help that stories often drop the adjective partisan when describing polarization.) It bears repeating that there has been no real growth in the number of Democrats or Republicans, which some might argue should be happening based on the term partisan polarization. Second, encompassing different processes under the single term robs polarization of some of its analytical bite. If the processes are different, we ought to acknowledge that by using different terminology. It is confusing enough for journalists and laypeople to hear social scientists give different interpretations based on the same set of data. We shouldn’t further muddy the waters by using the same term to describe very different processes. (Otherwise we should expect more stories with the headlines similar to “We’re Not That Polarized. Oh Yes, We Are”.) If journalists are going to rely on social scientists for guidance on these issues, we need to strive for clarity and precision in terminology. Finally, the implications of a growth in party sorting are much different than those emanating from increased political polarization. To use one example, if the public is more polarized, then it becomes harder to blame Congress for partisan gridlock, since they are simply mirroring broader divisions within their constituencies. But if the views of red state and blue state denizens are not so divergent on major issues, as the survey Balz cites suggests, then we must look elsewhere to place the blame.

In my view, polarization and sorting are two different processes, and we ought to recognize this. We can start by retitling Balz’s story: “We’re Not That Polarized. But We Are Better Sorted. And the Distinction Matters.”

Cleveland Rocks! But Probably Not Enough To Influence The 2016 Presidential Race

The Republican Party announced today that the party’s 2016 nominating convention will be held in Cleveland. The choice seems driven by the hope that it may influence the presidential vote in Ohio, which is likely to once again be a key swing state in the next presidential election. But if this is the hope, Republicans are likely to be disappointed. There is no evidence of which I am aware that the location of a convention influences the outcome of a presidential race. Indeed, the research – what little of it there is – suggests it will make no difference.

By way of background, some time back I reviewed an excellent paper written by Ben Lauderdale and Drew Linzer that cast a jaundiced eye on the ability of political scientists to forecast the outcome of presidential elections based on the so-called fundamentals, such as the status of the economy or whether the U.S. was at war or peace. Linzer, as some of you might recall, created the Votamatic website that used state-based polling to predict long before anyone (I think Drew issued his first prediction in June!) that Obama would win the 2012 presidential election with 331 electoral college votes. That prediction, as it turns out, was exactly correct. Note that on this website Drew utilized a Bayesian forecast model that essentially established a set of prior expectations rooted in Alan Abramowitz’s “time-for-a-change” forecast model, but then updated the Abramowitz forecast by incorporating state-based polls as they came in. By the time election day came around, Linzer’s model was almost entirely driven by state-based polls – it had largely discarded the Abramowitz forecast – and it nailed the final tally right on the nose.

Despite (because of!) this success, Linzer and his coauthor are skeptical regarding the accuracy of fundamentals-only based forecast models. In the Lauderdale/Linzer paper I reviewed, the authors argue “that it is a mistake to take any of these fundamentals-based model predictions too seriously.”  Elsewhere I will discuss why they are skeptical of most forecast models.  However, having cast doubt on the ability of traditional forecast models to predict the national vote with any degree of precision, the authors then proceed to present their own Bayesian forecast model, based on the 16 elections during the period 1952-2012. This model deliberately incorporates many of the elements in the most popular structural forecast models, but in a way designed to allow “the data to reveal which among a potentially large set of candidate variables are most predictive, letting forecasters remain agnostic about the economic and political factors that ‘really’ matter for predicting elections.” I will leave it to you to peruse their findings (although I find it somewhat reassuring that some of the usual suspects, such as economic measures, do seem statistically correlated with outcomes, albeit with a high degree of uncertainty).

I hope to discuss their results in a later post. For the purposes of today’s announcement by Republicans regarding the convention location, however, one of their findings is particularly relevant: Lauderdale and Linzer include a variable designed to measure the impact of a party’s convention on the presidential vote share!  They conclude, with what surely will disappoint Republicans, that “There is little evidence that the location of the national convention is predictive…” To be sure, the authors are careful to note that their forecast model also contains a great deal of uncertainty. Nonetheless, there’s nothing in the paper to suggest that choosing Cleveland will help Republicans win Ohio.

If there’s no evidence that convention location has much discernible impact on the presidential vote, then why choose Cleveland? The short answer is – why not? Doubtless party officials comforted themselves by noting that no Republican candidate has won the presidency without winning Ohio. Of course, there’s a whole list of election-related nostrums like this that are of dubious relevance.  Still, there’s no evidence it will hurt the party’s chances and there’s always the chance that, the Lauderdale/Linzer finding notwithstanding (and I have no evidence Republican party officials are even aware of the paper!) that it might help at the margins. In short, the decision was likely driven by the same reasoning that leads candidates to kiss every baby and shake every hand – they don’t know if it will help their electoral prospects, but it probably can’t hurt.

[UPDATE 12:03 Wednesday. Harry Enten has some data that comes to the same conclusion as Lauderdale/Linzer: convention location doesn’t matter.  See here.]

For now, however, I’m sticking with political science. Cleveland Rocks – but probably not when it comes to influencing the presidential election!

[youtube.com/watch?feature=player_detailpage&v=j1G2l_A9nB0<iframe width=”420″ height=”315″]