Monthly Archives: July 2010

Obama Take Note! The Paradox of Politicization, Or Why Presidents Do Not Really Control the Executive Branch

Today’s Washington Post contains a fascinating – and sobering look at the sprawling national intelligence community that has mushroomed in the wake of 9-11.  For long time readers of this blog, the article will sound familiar themes, since it largely supports my analysis of the failures of the the post 9-11 reforms – including the creation of a new super-coordinating office of national intelligence headed by a director of national intelligence (DNI) – to solve the  problems that allowed the 9-11 attacks to occur. Indeed, these reforms may have exacerbated the problem, and in perfectly foreseeable ways.

Recall that analysts blamed 9-11 on the failure of law enforcement and intelligence agencies to share information that would have enabled them to “connect the dots” to reveal the plan to hijack planes and fly them into the World Trade Center, the Pentagon and, in all likelihood, the Capitol. The DNI was established to prevent a recurrence of that bureaucratic failure. The idea was to create one central coordinating office whose job would be to overcome the jurisdictional boundaries and turf wars that prevented law enforcement and intelligence agencies from sharing information. In fact, the DNI has failed to accomplish this mission; rather than break down information barriers, it has established still another bureaucratic layer through which information must flow before it is analyzed and acted upon.  The result, as I wrote in my analysis of the failed Christmas Day crotch-bombing, has been to slow intelligence analysis and delay the ability of  agencies to react to that intelligence.   Rather than connecting dots, the organizational reforms have simply created more dots that need connecting.

As evidence, here’s what the WaPo story says about the crotch-bombing incident which I discussed in some detail in previous posts:

“Last fall, after eight years of growth and hirings, the enterprise was at full throttle when word emerged that something was seriously amiss inside Yemen. In response, President Obama signed an order sending dozens of secret commandos to that country to target and kill the leaders of an al-Qaeda affiliate. In Yemen, the commandos set up a joint operations center packed with hard drives, forensic kits and communications gear. They exchanged thousands of intercepts, agent reports, photographic evidence and real-time video surveillance with dozens of top-secret organizations in the United States.

That was the system as it was intended. But when the information reached the National Counterterrorism Center in Washington for analysis [the NTCT reports directly to the DNI], it arrived buried within the 5,000 pieces of general terrorist-related data that are reviewed each day. Analysts had to switch from database to database, from hard drive to hard drive, from screen to screen, just to locate what might be interesting to study further.

As military operations in Yemen intensified and the chatter about a possible terrorist strike increased, the intelligence agencies ramped up their effort. The flood of information into the NCTC became a torrent.

Somewhere in that deluge was even more vital data. Partial names of someone in Yemen. A reference to a Nigerian radical who had gone to Yemen. A report of a father in Nigeria worried about a son who had become interested in radical teachings and had disappeared inside Yemen.

These were all clues to what would happen when a Nigerian named Umar Farouk Abdulmutallab left Yemen and eventually boarded a plane in Amsterdam bound for Detroit. But nobody put them together because, as officials would testify later, the system had gotten so big that the lines of responsibility had become hopelessly blurred. “There are so many people involved here,” NCTC Director Leiter told Congress.

“Everyone had the dots to connect,” DNI Blair explained to the lawmakers. “But I hadn’t made it clear exactly who had primary responsibility.”

And so Abdulmutallab was able to step aboard Northwest Airlines Flight 253. As it descended toward Detroit, he allegedly tried to ignite explosives hidden in his underwear. It wasn’t the very expensive, very large 9/11 enterprise that prevented disaster. It was a passenger who saw what he was doing and tackled him. “We didn’t follow up and prioritize the stream of intelligence,” White House counterterrorism adviser John O. Brennan explained afterward. “Because no one intelligence entity, or team or task force was assigned responsibility for doing that follow-up investigation.”

Blair acknowledged the problem. His solution: Create yet another team to run down every important lead. But he also told Congress he needed more money and more analysts to prevent another mistake.

More is often the solution proposed by the leaders of the 9/11 enterprise.”

My point here is not to pat myself on the back because WaPo came to the same conclusion as I did.  Instead, it is to remind you that this is not an isolated incident, but in fact is a reflection of a more deep-seated problem with efforts to reform the intelligence bureaucracy in the wake of 9-11. The failure to anticipate the Christmas Day crotch-bombing, or the Fort Hood shooting, points to a larger problem, one that many of my political science colleagues who write about the presidency and the bureaucracy have failed to grasp.  Without going too deeply into the details of what might strike some as an arcane academic dispute, there are some presidency scholars who believe the President is well situated to manage the federal bureaucracy.  Through his control of budgeting, personnel appointments, and legislative and regulatory policy, they argue, the President possesses levers by which to make the bureaucracy respond to his policy preferences.  Over time, they claim, presidents have used these tools to create a more presidency-friendly executive branch.  A key reason they are able to do so, these scholars argue, is because presidents are unitary actors, whereas Congress suffers from significant collective action problems. The result is that in the struggle to control the executive branch, presidents have a built-in institutional advantage.

Without putting too fine a point on it, this analysis is, in my view, hopelessly naïve. The idea that the President is a “unitary actor” betrays a gross ignorance of the environment in which presidents operate, and of the process by which presidents make decisions.  In most cases involving the bureaucracy, their “unilateral” choices are in fact based on options presented to them by other actors and institutions who rarely if ever share the president’s political or institutional perspective. The idea that presidents’ act “unilaterally” is true in only one respect: they are held responsible for the actions of the executive branch bureaucracy.  But to assume they control that bureaucracy is – as Obama is discovering – pure fantasy.  (Do you think Obama controlled the MMS – the agency that approved BP’s permit request to drill in the Gulf?)

The “levers” of control cited by these political scientists who believe presidents can manage the executive branch are of far less use to presidents than they appear to be on paper, in part because presidents don’t know what to do with them and in part because they are shared with other actors.  The result is that the notion that the executive branch is a unified entity that responds to the commands of one man – the President – at the top is a gross and misleading simplification.  I am currently working on a book project with Andy Rudalevige that develops these points in more detail and I’ll try to draw on that research in future posts to develop this argument.

But consider the post-9-11 reforms.  At first glance, this seems striking evidence that presidents can control the bureaucracy.  In this case, President Bush established a coordinating czar, the DNI, superimposed on the existing bureaucracy, who reports directly to the President. The President can appoint the DNI (with Senate approval), and – as Obama recently did – fire him.  The reality, however, as Obama discovered and as the WaPo article documents, is that the DNI lacks the control over agency budgets and personnel necessary to fulfill this coordinating mission.  Why does the DNI lack this coordinating authority?  Largely because the agencies that were supposed to be coordinated used their political influence to make sure Congress prevented any real loss of autonomy when the DNI was established.  On paper, then, it appears the President, through the creation of the DNI, has “presidentialized” the intelligence gathering process – the DNI’s office has exploded in size (it now numbers some 1,500) and has a huge budget.  In fact, this growth masks a relative lack of authority – the intelligence bureaucracy is arguably less responsive to presidential control than it was before the reforms.  Rather than “presidentialized”, the intelligence bureaucracy has effectively resisted reform – resistance largely due to Congressional support.

The failure to establish true coordinating authority centered in a DNI reporting directly to the President reveals a more fundamental problem – one that is at the heart of my research.  I call it the paradox of politicization. Simply put, the more presidents try to politicize the administrative levers by which to move the executive branch bureaucracy – personnel appointments, budgeting, and legislative and regulatory clearance – the more they erode the administrative capacity of the very agencies they seek to control. In the long run – as Obama discovered with the crotch-bombing, or in the aftermath of the Gulf oil spill, when agencies fail to fulfill their mission, it is the president who suffers.  In short, efforts to strengthen their control over the bureaucracy have weakened presidential authority – precisely the opposite result presidents hoped to achieve.

As part of my research, I recently talked to a former employee of the Bureau of the Budget who pointed out that at one time the BoB (now OMB) had a division of administrative management that was staffed with careerists who possessed a wealth of knowledge and expertise regarding executive branch functions and history.  (For those who are interested, Andy and I have written (gated) about the creation of the BoB’s management division during FDR’s presidency.)  During the last several decades, however, as presidents have layered the upper level of the OMB with political appointees, the administrative management functions have atrophied, in part because the careerists with the relevant expertise simply have less contact with the OMB director, to say nothing of the President.  The former BoB official noted that during discussion to create the Department of Homeland Security, only one OMB official was involved, and he was largely a bystander in a process controlled by the White House’s political appointees. Today, he told me, there is no one in government with the expertise or knowledge to advise presidents about how to organize the executive branch.  That institutional memory is simply gone, a victim of the politicization that so many political scientists mistakenly view as evidence of enhanced presidential control.

The study of bureaucracy is not a sexy topic. And the loss of administrative competence that I allude to here may strike some as a rather uninteresting topic, better suited for an academic journal than a popular blog. But it has real consequences for the effectiveness of government programs – and for the political fortunes of presidents who must deal with the misguided perceptions, created in part by political scientists, that presidents actually control the executive branch.  The sooner we dismiss this misconception, the more quickly we can address the problems cited in today’s WaPo article.

Is the Public Stupid? When A Chart Is Not Worth A Thousand Words

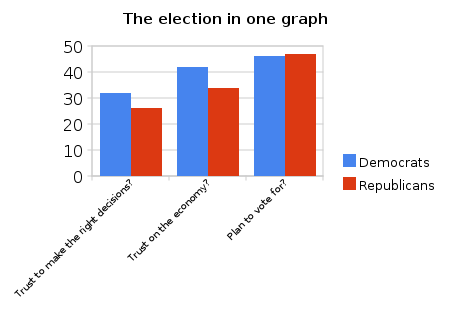
This item from yesterday’s Washington Post caught my eye as a useful teaching moment.  Ezra Klein posted this graph, based on this most recent Washington Post/ABC Poll,  under the label “A chart is worth a thousand words”:

It’s not clear what Klein’s point is, but presumably he means to point out just how illogical voters are, since they trust Democrats more than Republicans on handling the economy and to make the “right decisions”, and yet a plurality (by a slim percentage) are planning to vote Republicans into office.

There’s only one problem with this graph. If you actually go to the data in the poll from which Klein constructed it, you’ll see that the first two bars are based on a sample of all adults, while the last bar, which graphs the partisan breakdown of responses to the question “who do you plan to vote for?” is based on a sample of only registered voters.

Longtime readers have heard this refrain before, but it bears repeating for those who have just tuned in:  samples based on registered voters tend to skew slightly more Republican than do samples based on all adults.  The basic reason is that samples of all adults include more Democrat supporters who are less likely to vote. Or, to put it another way, Klein is comparing apples to oranges.

How big is the difference? It varies, of course, from poll to poll depending on sampling procedures, etc. Ideally, of course, we’d test the premise by having polling outfits conduct split sample surveys that compare response rates of both likely and registered voters to all adults.   That’s expensive, however, so most polling outfits do one or the other.  (Presumably WaPo switched to registered voters from all adults on the “who are you planning to vote for?” question because for this question they wanted to sample those most likely to vote, rather than all adults.)

However, we can get some leverage on the issue by looking at past Washington Post polls that have polled both groups in close temporal proximity, if not at the same time.   Here’s an example.

18. (ASKED OF REGISTERED VOTERS) If the election for the U.S.
House of Representatives in November were being held today,
would you vote for (the Democratic candidate) or (the Republican
candidate) in your congressional district? (IF OTHER, NEITHER,
DK, REF) Would you lean toward the (Democratic candidate) or
toward the (Republican candidate)?
NET LEANED VOTE PREFERENCE
               Dem     Rep     Other    Neither    Will not       No
               cand.   cand.   (vol.)    (vol.)   vote (vol.)   opinion
7/11/10  RV     46      47       *         2           *           5
6/6/10   RV     47      44       2         2           1           4
4/25/10  RV     48      43       1         2           1           6
3/26/10  RV     48      44       1         2           *           4
2/8/10   RV     45      48       *         3           *           4
10/18/09 All    51      39       1         3           2           5

Note the big difference when WaPo switches from sampling all voters, in October, 2009 versus a sample of registered voters in February, 2010.  Democrats go from being preferred by 12% to being behind by 3% – a net shift of 15%.  Yes, the polls were four months apart, so it’s possible voters’ preferences simply shifted that much in the intervening time.  Note that we don’t see any comparable shift in subsequent months, however.

Next, let’s look at previous WaPo/ABC polls that asked respondents which party they trusted more to handle the economy.  Fortunately, in September, 2002 WaPo asked a sample of all adults “Which political party, the (Democrats) or the (Republicans), do you trust to do a better job handling the economy?”  In the following month, they asked this of likely voters and then two months later of all adults again. Note that likely voters tend to skew Republican even more than registered voters. In September, the random sample of all adults indicated that they trusted the Democrats more, by 8%. The next month, when WaPo sampled only likely voters, the country changed its mind and now trusted Republicans more by 5%. That is, Republicans picked up 9% while Democrats dropped 4% in the switch from sampling all adults to sampling likely voters – a net switch of 13%.  Two months later, WaPo went back to sampling all adults, and Democrats closed the trust gap, essentially matching Republicans’ support.  The following table summarizes the results:

Date Democrat Republican Both Neither No Opinion
12/15/02 44 45 4 6 1
10/27/02  LV 43 48 3 3 2
9/26/02 47 39 3 6 5

Again, it’s possible that the public’s view toward the two parties’ ability to handle the economy changed from September to October, and then shifted back from October to December.  But it is more like, in my view, that the change reflects the difference response one receives when sampling all adults versus sampling likely voters.

This difference in partisan response rates for survey of all adults, registered voters, and likely voters, permeates all polls.  As evidence, look at this recent Times poll asking

“There will be an election for U.S. Congress in November. If you had to decide today, would you vote for the Democratic candidate in your district or the Republican candidate?”

Fortunately, the Times asked this of both likely voters and registered voters at the same time.  Here are the responses:

Population Sampled Democrat Republican Tea Party Other Unsure
Likely Voters 43 42 1 2 12
Registered Voters 47 43 1 3 6

Even when considering registered and likely voters, we see a slight Republican bias in the likely voter response.  Of course, the differences are small and close to the poll’s margin of error, so we can’t be sure the difference is driven by the different population samples.  But we can’t dismiss it either.  More generally, if you look at the dozens of polls that have asked versions of this “who will you vote for?” question this year, Republicans do better in surveys of likely voters versus registered voters, and better among registered voters than among all adults.  You can see for yourself here, by looking at the specific polls under the  2010 midterm section.

Now, let’s return to the original numbers on which Klein based his graph. The first table has the results for the question “who do you trust to make the right decision” asked of all adults.

Date Democrat Republican Both Neither No Opinion
7/11/10 42 34 3 17 5

And here are the percentages of the responses to “who do you trust to handle the economy?” again asked of all adults. (Respondents favoring Democrats in the first column, those favoring Republicans in the second.  I’ve omitted the “just some” and “not at all” categories to be consistent with Klein’s chart.)

7/11/10 32 26

What happens if you shift the net results to these two questions, say, about 5% toward the Republicans, which is consistent with the likely impact of surveying registered voters, as opposed to all adults?  Suddenly, given the 4% margin of error, Republicans are virtually tied with Democrats in terms of which party is preferred by voters for handling the economy, and for making the right decisions.  That is, the findings Klein cites in his chart that shows Republicans and Democrats in a dead heat in terms of registered voters’ preferences in the 2010 midterms seems quite consistent with the survey results for these two questions.

My point isn’t that Klein is wrong.  In fact, the public could be acting illogically by voting for the party they trust least to handle the economy or to make the right decisions.  However, the difference he cites might just be a function of sampling different populations. We can’t be sure.  If I’m Klein, I would likely point this out rather than present a chart in a way that implies the public is, as one person commenting put it, “Stupid.”

I should be clear: I’m not accusing Klein of any chicanery here.  It’s possible he didn’t notice that his first two survey responses were based on samples of all adults, while the third was based on a sample of registered voters.  More likely, in my view, is that he saw the chance to flag an “Aha!” moment, which makes for a good column, and simply didn’t bother checking the underlying data. Whatever  the explanation, it is a reminder (yes, I know, you’ve heard it from me a thousand times) that you can’t simply take a columnist’s word about how to interpret polling results.  You have to look at the poll itself.

Bottom line?  A chart may be worth a thousand words – but sometimes it doesn’t say anything at all.

Once More With Feeling: Are the Tea Partiers Racist? Why It May Not Matter

The recent vote by NAACP delegates in favor of a resolution “to condemn extremist elements within the Tea Party” and “calling on Tea Party leaders to repudiate those in their ranks who use racist language in their signs and speeches” has, predictably, refocused attention among the punditcrats on an issue that we have discussed several times before on this blog.   But the most recent batch of commentary is, in my view, missing the real story.

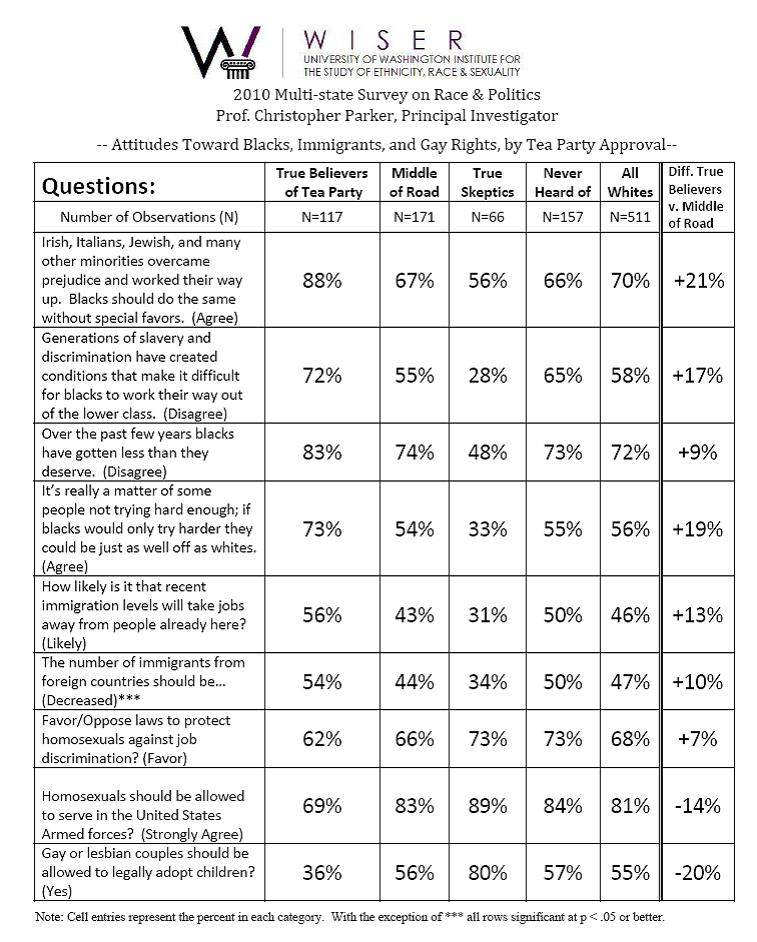
To see why,  I want to begin with a 7-state study conducted by Chris Parker and his colleagues at Washington University designed to measure the racial attitudes of Tea Party supporters compared to other groups.  (Thanks to Bob Johnson for asking me to comment on the Parker study.)  The Parker findings are based on a probability sample, consisting of 1006 cases stratified by states that were chosen because six of them were “battleground” states in 2008.  I urge you to look at Parker’s results using the link above, but here are some highlights, as summarized in this table:

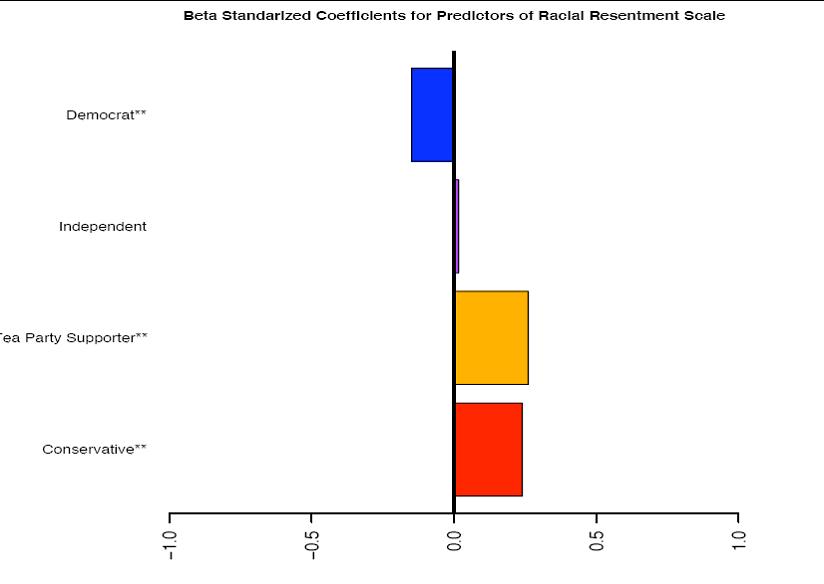
What do we make of these findings, including the significant difference in the racial views of Tea Partiers versus non-Tea Partiers, including the “middle of the road” respondents?  Note that Parker and his colleagues reject the argument made by some conservatives that racial “resentment” is largely a function of ideology, as opposed to racial views.  When they construct an “index” of racial resentment based on answers to these survey questions, and run a regression, they find that being a Tea Party member is a significant predictor of adopting an attitude of racial resentment, even when controlling for ideology and partisanship, as indicated in the following figure.

They conclude, “[E]ven as we account for conservatism and partisanship, support for the Tea Party remains a valid predictor of racial resentment. We’re not saying that ideology isn’t important, because it is: as people become more conservative, it increases by 23 percent the chance that they’re racially resentful. Also, Democrats are 15 percent less likely than Republicans to be racially resentful. Even so, support for the Tea Party makes one 25 percent more likely to be racially resentful than those who don’t support the Tea Party.”

I  have some concerns about this study. To begin, I am uncomfortable with the  wording of some of the survey questions themselves and whether they are really tapping into “racial resentment” or some other policy dimension.  Clearly some of these concerns, such as attitudes toward immigration, have an economic component.

Other questions are asked in ways that are likely to skew results (although not necessarily differences in response rate by subgroup.)   For example, question one asks respondents to compare the histories of Irish, Italians and Jews with blacks in their ability to overcome prejudice and work their way up “without special favors.” There’s a large body of survey research that shows that when you include “hot button” words like “special favors” or “quotas”, or anything similar that suggests preferential treatment for one group as opposed to another, support for the policy in question goes down. Thus it doesn’t’ surprise me that more than half of those who are skeptics of the Tea Party movement nevertheless agree that blacks should overcome discrimination “without special favors.”

Partly because of my concerns over question wording, and uncertainty regarding just what these questions are measuring, I also wish Parker did not report only the results based on using an index of “racial resentment” as his dependent variable when trying to gauge the relative importance of  Tea Party support, ideology and partisanship on holding racially resentful views.  Instead, I wish he had shown the regression results for partisanship and ideology and Tea party membership for each of the nine survey questions.  That would more clearly show, I think, just what element in the “racial resentment” index most clearly differentiates Tea Partiers from other groups.

Finally, one might have also preferred that his regression predicting whether one holds racially intolerant views controlled for some basic demographic variables (age, gender, income, etc) that might influence results. Had he done so it is possible that some of the effects he attributes to being a Tea Party member will wash out. In Parker’s defense, however, he’s working with such small subsamples that it may be difficult to estimate more detailed regressions.

These methodological issues aside,  there’s an additional reason for my uncertainty in evaluating Parker’s findings: they seem to contradict the results of other surveys, including these findings by ABC survey analyst Gary Langer.   Langer analyzes a survey of Tea Party supporters and non-Tea Partiers and concludes:  “Ultimately, a statistical analysis indicates that the strongest predictors of supporting the Tea Party are views of Obama, ideology, partisanship and anger at the way the government is operating. Views on the extent of racism as a problem, and views on Obama’s efforts on behalf of African-Americans, are not significant predictors of support for the Tea Party movement.”

At first glance, Langer’s results seem to oppose Parker’s.   What explains the difference?  I can’t be sure, in part because when I link to the study Langer cites, he presents the results but not the actual regression analysis. So I don’t know what regression he actually ran, or the coefficients, etc.

Of course, both analysts could be right because they are not, strictly speaking, measuring the same thing. Langer is trying to predict what factors contribute to a decision to support the Tea Party, and concludes that racial views (however he defines this) is not one of them. Parker is trying to explain whether one holds views suggesting “racial resentment” and concludes that being a member of the Tea Party is a statistically significant predictor of having this attitude.

These methodological concerns notwithstanding, I think Parker’s results showing the differences in racially-oriented views between these subgroups is very provocative, and it is as good as I have seen on this topic.  Until better or more detailed surveys come around, it certainly deserves the coverage it has received (see here and  here).  But I think this coverage, such as the commentary by E.J. Dionne and Charles Blow – indeed, almost everyone who has commented on Parker’s results – are missing the real significance of his findings.   Let us assume for the sake of argument that the results in the table above should be taken at face value.  Look more closely at the differences not just between Tea Partiers and “middle of the road” respondents (however they may be defined).  Look also at the difference in views between the middle of roaders and the Tea Party “skeptics.”  If you compare the differences, you find that for seven of the nine questions, the middle of the roaders’ view are as close or closer (keeping in mind the 3% margin of error in the responses) to those of the Tea Party than they are to the Tea Party skeptics! On three questions, middle respondents are much closer to the Tea Party, while on two they are closer to Tea Party skeptics.  On the remaining four they are equally close to either set of outliers – Tea Partiers or Skeptics.

Why is this important?  Because when moderate voters (that is, Parker’s middle of the roaders) go to the polls, they don’t get to vote for their favorite centrist policy – they choose among two candidates, neither of whom may share their more  moderate views.  Parker’s results suggest that, given a choice between a racially resentful Tea Party candidate or one who runs on the Tea Party skeptics’ racial views, they may be more likely to support the Tea Party candidate.  Keep in mind that the partisan purists on both end of the spectrum are the ones who are not easily persuaded to cross party lines and vote for the other candidate.  It is the middle of the roaders who are most willing to do so.

Moreover, this is based only on a survey that focuses on racial issues.  It is not a stretch to imagine that on economic issues – jobs, government spending, the deficit – moderates may skew even more toward the Tea Party candidate if she’s opposed by a Democrat who voted in favor of the stimulus package, the Obama health care bill, and the bank bailout.

This is something Sarah Palin has grasped much more quickly than the other Republican candidates: in a highly polarized environment in which support for the party in charge is dwindling, you don’t have to be in the center on all the issues – you just have to be the last opposition candidate standing when the voters opt for “change”.  Look no further than Barack Obama to see the wisdom in this strategy.

In the current political climate, that may mean hitching one’s wagon to the Tea Party movement.  Palin has come closest of all the Republicans to becoming the face of this movement.  Thus I was not surprised to see that she chimed in here to blast the NAACP resolution, a stance that will undoubtedly strengthen her support among Tea Partiers and not incidentally also boost her growing fundraising powers.  (Her most recent quarterly earnings were her biggest to date – more on this on a later post.)

My point is that Democrats ought not to take any solace in Parker’s findings. Rather than dismissing the Tea Partiers as racists, they would do far better to  address those factors they can potentially influence, particularly the policy ideas that are motivating, to a greater or lesser degree, this movement: government spending and the deficit, unemployment, and the general perception that government has grown too large and that the nation’s ruling political class is out of touch with the concerns of ordinary Americans.

It Really Is a Science

Politico’s David Catenese has picked up on (story here) the Research 2000-Markos Moulitsas fraud story I blogged about yesterday.  In addition to the Blanche Lincoln-Bill Halter Arkansas Democrat Senate race, Catanese reminds us that Research 2000 also published a poll in May suggesting Tom Campbell was soundly whipping (up 15%) Carly Fiorina in the California Republican Senate contest.  In fact, Fiorina crushed Campbell by 34%.

Catanese cites the story because these polls – even though they were wrong – helped drive the media narrative in both races.  He hints that they may have changed the campaign dynamics in ways that, had the race been closer, even altered the outcome.

My purpose in writing about this again, however, is slightly different.  I’m less concerned with the impact of these inaccurate polls on the races, and more interested in the debate regarding whether the company defrauded the Daily Kos founder by manipulating (making up?) data and generally failing to do what Kos hired them to do.  As someone who is a voracious consumer of polling data in this blog (as longtime readers know) but who does not produce surveys, I have a very strong interest in understanding the details of this story.   I  want to be sure that the results I present you are credible.

Of course, I realize that not all of you share my fascination with the nuts and bolts of polling, so I’m not going to delve too deeply into the details of the fraud case.  But I thought it might be interesting for some of you (particularly my political science students!) to get a sense of the evidence that is being cited against Research 2000.  For example, here are a couple of points of contention that are being debated.

1. Minor details in the survey data released by Research 2000, such as the trailing digits in some of the cross-tabs, suggest the figures were not produced by a random sampling process but instead were created by other means. For instance, if the results from respondents who were men in a particular category (say, percent men who approved of Obama) ended in an even number, the same would be true for the results for women in that category – they would also end in an even number. This happened far too frequently to occur by chance; as Mark Blumenthal points out, one would have a greater chance of winning the lottery than of seeing this pattern of results in the trailing digits. But does this prove fraud?  Not necessarily – as others point out, it might be a function of how data was stored and retrieved, a data coding error, or some other weird statistical algorithm.

2. Nate Silver in this post suggests that Research 2000 results for its daily tracking poll did not vary as much as they should have with a simple random sampling procedure. Without going into too much detail, the argument here is similar to the idea that if you flip a coin, and keep track of the heads versus tails, you are going to get a 50/50 split on average, but there will be a statistically predictable variation around this average.  Research 2000 results don’t show the expected variation – they show much less.  Again, Silver suggests this indicates the tracking numbers were manipulated. But as Doug Rivers notes, Silver’s assumption that Research 2000 used a simple random sampling procedure is almost surely wrong.  Most polling is done through stratified sampling – that is, the pollster breaks the sample down into subgroups, such as Republicans and Democrats, or men and women, and then randomly samples from each subgroup.  This would have the effect of producing a final poll that would show much less variability around the sampling mean, that is, the Research 2000 daily tracking poll results would vary less than if the polling was done by simple (not stratified) random sampling, as Silver assumes.

These are just a couple of points that are being debated in much greater detail than I suggest here, and by some really smart people. I realize that this sounds like a lot of “inside baseball” that is not of interest to all of you.  However, I urge those who are interested (particularly my students) to click on some of the links I’ve placed here and work through the arguments.  The math is actually very straightforward – the more difficult part, really, is wading through the jargon that commentators use.

These examples serve a larger point, however, which is why I’ve returned to this topic for a second day.  None of what has been presented so far conclusively proves Research 2000’s guilt or innocence.  The on-going debate, however, is a reminder that there’s a peer-review process at work here, in which those with the expertise to tackle these issues are doing so in a very transparent, albeit somewhat messy, manner. Because of the wonders of the internets, you can actually track the debate virtually in real time. It’s a fascinating process to watch, not least because of the interaction of established statisticians with up-and-coming grad students hoping to make a name for themselves. There’s lots of give and take, some of it acrimonious, but most of it refreshingly free of personal animosity (albeit nerdy to the extreme.)

And it’s a reminder why I enjoy writing this blog – I get to piggyback on the work of a bunch of people who are smarter than me and bring you the results in ways that are, I hope, relevant to the news you read about – like polling results.

I expect that because of this debate over Research 2000’s methods, polling will be both more transparent and more credible – at least that’s the hope.  So come November, when I roll out my pre-midterm election forecasts based in part on polling data, you’ll have some confidence that there really is a peer-reviewed science at work on which I’m basing my arguments, and that I’m not just making it up as I go along.