The organization of your ideas is critical for readers to best understand the information you present.
Broad components of organization involve your formatting and section headings, such as your title. Finer organization happens within sections or paragraphs, such as the order in which you present a set of ideas. In all parts of a journal article, poster, or research proposal, the organization of your information is clearly shown using distinct headings.
What should be the broad organization of my writing?
In academic research, one of the most useful ways to organize your writing is in an “hourglass” shape that mimics the relative scopes of the topics you discuss. At the top of the hourglass (the beginning of your writing) are the most broad pieces of information, such as why your research is relevant on the scale of the Earth. This introduction should get narrower and narrower towards the middle of the hourglass, when you discuss the details of your research–what you did (or will do, in a proposal) and what the results were (or what you predict them to be). You can then broaden the results into what they mean in terms of your project as a whole and finally back to the scale of the greater world, which forms the base of the hourglass.
Journal Article
The structural design of a journal article takes form through the sections often called “Introduction, “Methods,” “Results,” and “Discussion.” Alternatively, in some journals, the results and discussion will be combined, and a “Conclusions” section is used to discuss the broader implications of the work. Journal articles also include the broader structural elements of a title, abstract, acknowledgements, and references. Subsections are often present in the methods, results, and discussion sections, which help the reader find and better understand different topics within the paper.
It is important to mark each of these sections with clear headings. Differentiating between levels of heading hierarchy with different fonts is very helpful to a reader who wants to navigate the sections quickly.
Note: Every publication has its own rules and guidelines for formatting the broad organization of your paper. Your professor may want you to adhere to one of these published standards or to adhere to a standard of their own–check with the publication or professor to whom you’re submitting your paper for what they will accept.
The following is an example of a paper in IMRD format (adapted from McGinnis et al. 2007):
|
Introduction Abuse of anabolic androgenic steroids (AAS) has increased dramatically in recent years. AAS abuse has become a public health issue, and evidence of numerous undesirable behavioral changes such as hyperactivity and sleep disturbances has been reported. In order to provide a comprehensive assessment of the effects of AAS on the chronobiological regulation of activity, there were three hypotheses that guided this study. The first hypothesis was that exposure to AAS would influence wheel running activity and circadian rhythms. The second hypothesis was that AAS with dissimilar chemical characteristics would differentially affect both the level of wheel running activity and circadian parameters. The third hypothesis was that chronic AAS exposure would have an impact on the ontogenetic development of wheel running activity and circadian rhythms. In this study, to better understand the biological consequences of AAS exposure on activity levels and circadian rhythms, we measured body and tissue weights and serum testosterone levels. Methods Subjects and treatment groups. Forty-eight male Long–Evans rats, approximately 25 days old, were purchased from Charles River Labs (North Wilmington, MA, 01887, USA). Each rat was randomly assigned to one of four treatment groups: testosterone propionate (T), nandrolone (N), stanozolol (S) and control (C). AAS treatment. In order to eliminate the effects of repeated handling and injections of the animals while in the running wheels, we used timed-release pellets designed to administer 200 mg of hormone at a constant rate for 60 days. This dosage reportedly provides approximately 3.3 mg AAS/rat/day. Interscapular subcutaneous implants were inserted under a ketamine (100 mg/ml) and xylazine (18 mg/ml) anesthesia mix injected ip at 0.75 ml per kg body weight with wound clip sutures. Statistical analysis. Main effects of AAS treatment and post-hoc comparisons among specific AAS groups were derived from analysis of variance using the GLM procedure in SAS (SAS Institute, Carey, NC, USA). Values are reported as mean +/− SEM. Mean differences from baseline within groups were tested against the null hypothesis of no change with the paired t-test. Results Wheel running activity. AAS treatment significantly altered wheel running activity (Fig. 1). Post-hoc analysis revealed that T significantly (p < 0.05) increased mean activity levels in both LD and RR conditions relative to controls. In contrast, N treatment resulted in a significant (p < 0.05) decrease in wheel running activity in both LD and RR conditions. Mean activity levels of S-treated males were similar to controls. Circadian period. Sample actograms are shown in Fig. 3 for baseline and post-treatment in LD and RR for each treatment group. There were no statistically significant effects of AAS treatment on circadian period.There was a significant decrease in circadian period over the course of development in all groups. The mean changes in circadian period was − 0.15 +/− 0.04 h from periodogram estimates (p < 0.001) and − 0.07 +/− 0.03 h for best-fit regression line estimates (p < 0.05). Discussion Effects of AAS on circadian rhythms. The increase is in comparison to gonadally intact males–not castrates–suggests that very high testosterone levels can influence running wheel activity and may be responsible for some of the side effects of AAS reported in humans such as hyperactivity and disturbances in sleep patterns. The increased running wheel activity is consistent with earlier studies showing that exposure to chronic high levels of testosterone increases other androgen-dependent behaviors such as aggression, sexual behaviors and scent marking. Developmental changes in circadian function. One of the most striking and consistent findings from our study was a change in circadian phase and period over the course of development. Although humans and other species such as Octodon and rats show changes in circadian phase across puberty, the differences in direction may reflect species-specific mechanisms. The lack of effect on phase of activity onset in our study suggests that the time of activity onset does not shift, but the distribution of activity does. Conclusions. Three major findings resulted from this study. First, chronic exposure to AAS affects wheel running activity without altering circadian clock regulation of activity. Second, the expression of running wheel activity in male rats is explicitly modified by the specific chemical nature of the AAS. Third, adult patterns of activity and circadian rhythms change over the course of adolescent development. |
Notice how the major section headings, such as “Discussion,” are different (and stand out more) than the headings for each sub-section, such as “Effects of AAS on circadian rhythms.” These sections can also be numbered 1, 2, 3, and 4 in addition to the headings, with subsections numbered 2.1, 2.2, etc.
Poster
Posters are organized like condensed journal articles, with major sections separated from one another by an obvious heading, including the introduction, methods, results, discussion, title and authors, acknowledgements, and a short references section. Because posters are used to present information rather than interpret it, it is more common in posters than in journal articles to combine the “results” and “discussion” sections and have a short “conclusions section” instead. To preserve space, posters generally do not include an abstract.
The flow from one section to another should look similar to in a journal article, with broad topics (i.e. your introduction and conclusions) coming at the beginning and end, while narrower topics (i.e. your methods and results) falling in the middle. The way you choose to arrange these on your poster board is mostly up to you, although it should somehow flow from left to right and from top to bottom. For example, one common format uses three columns such as:
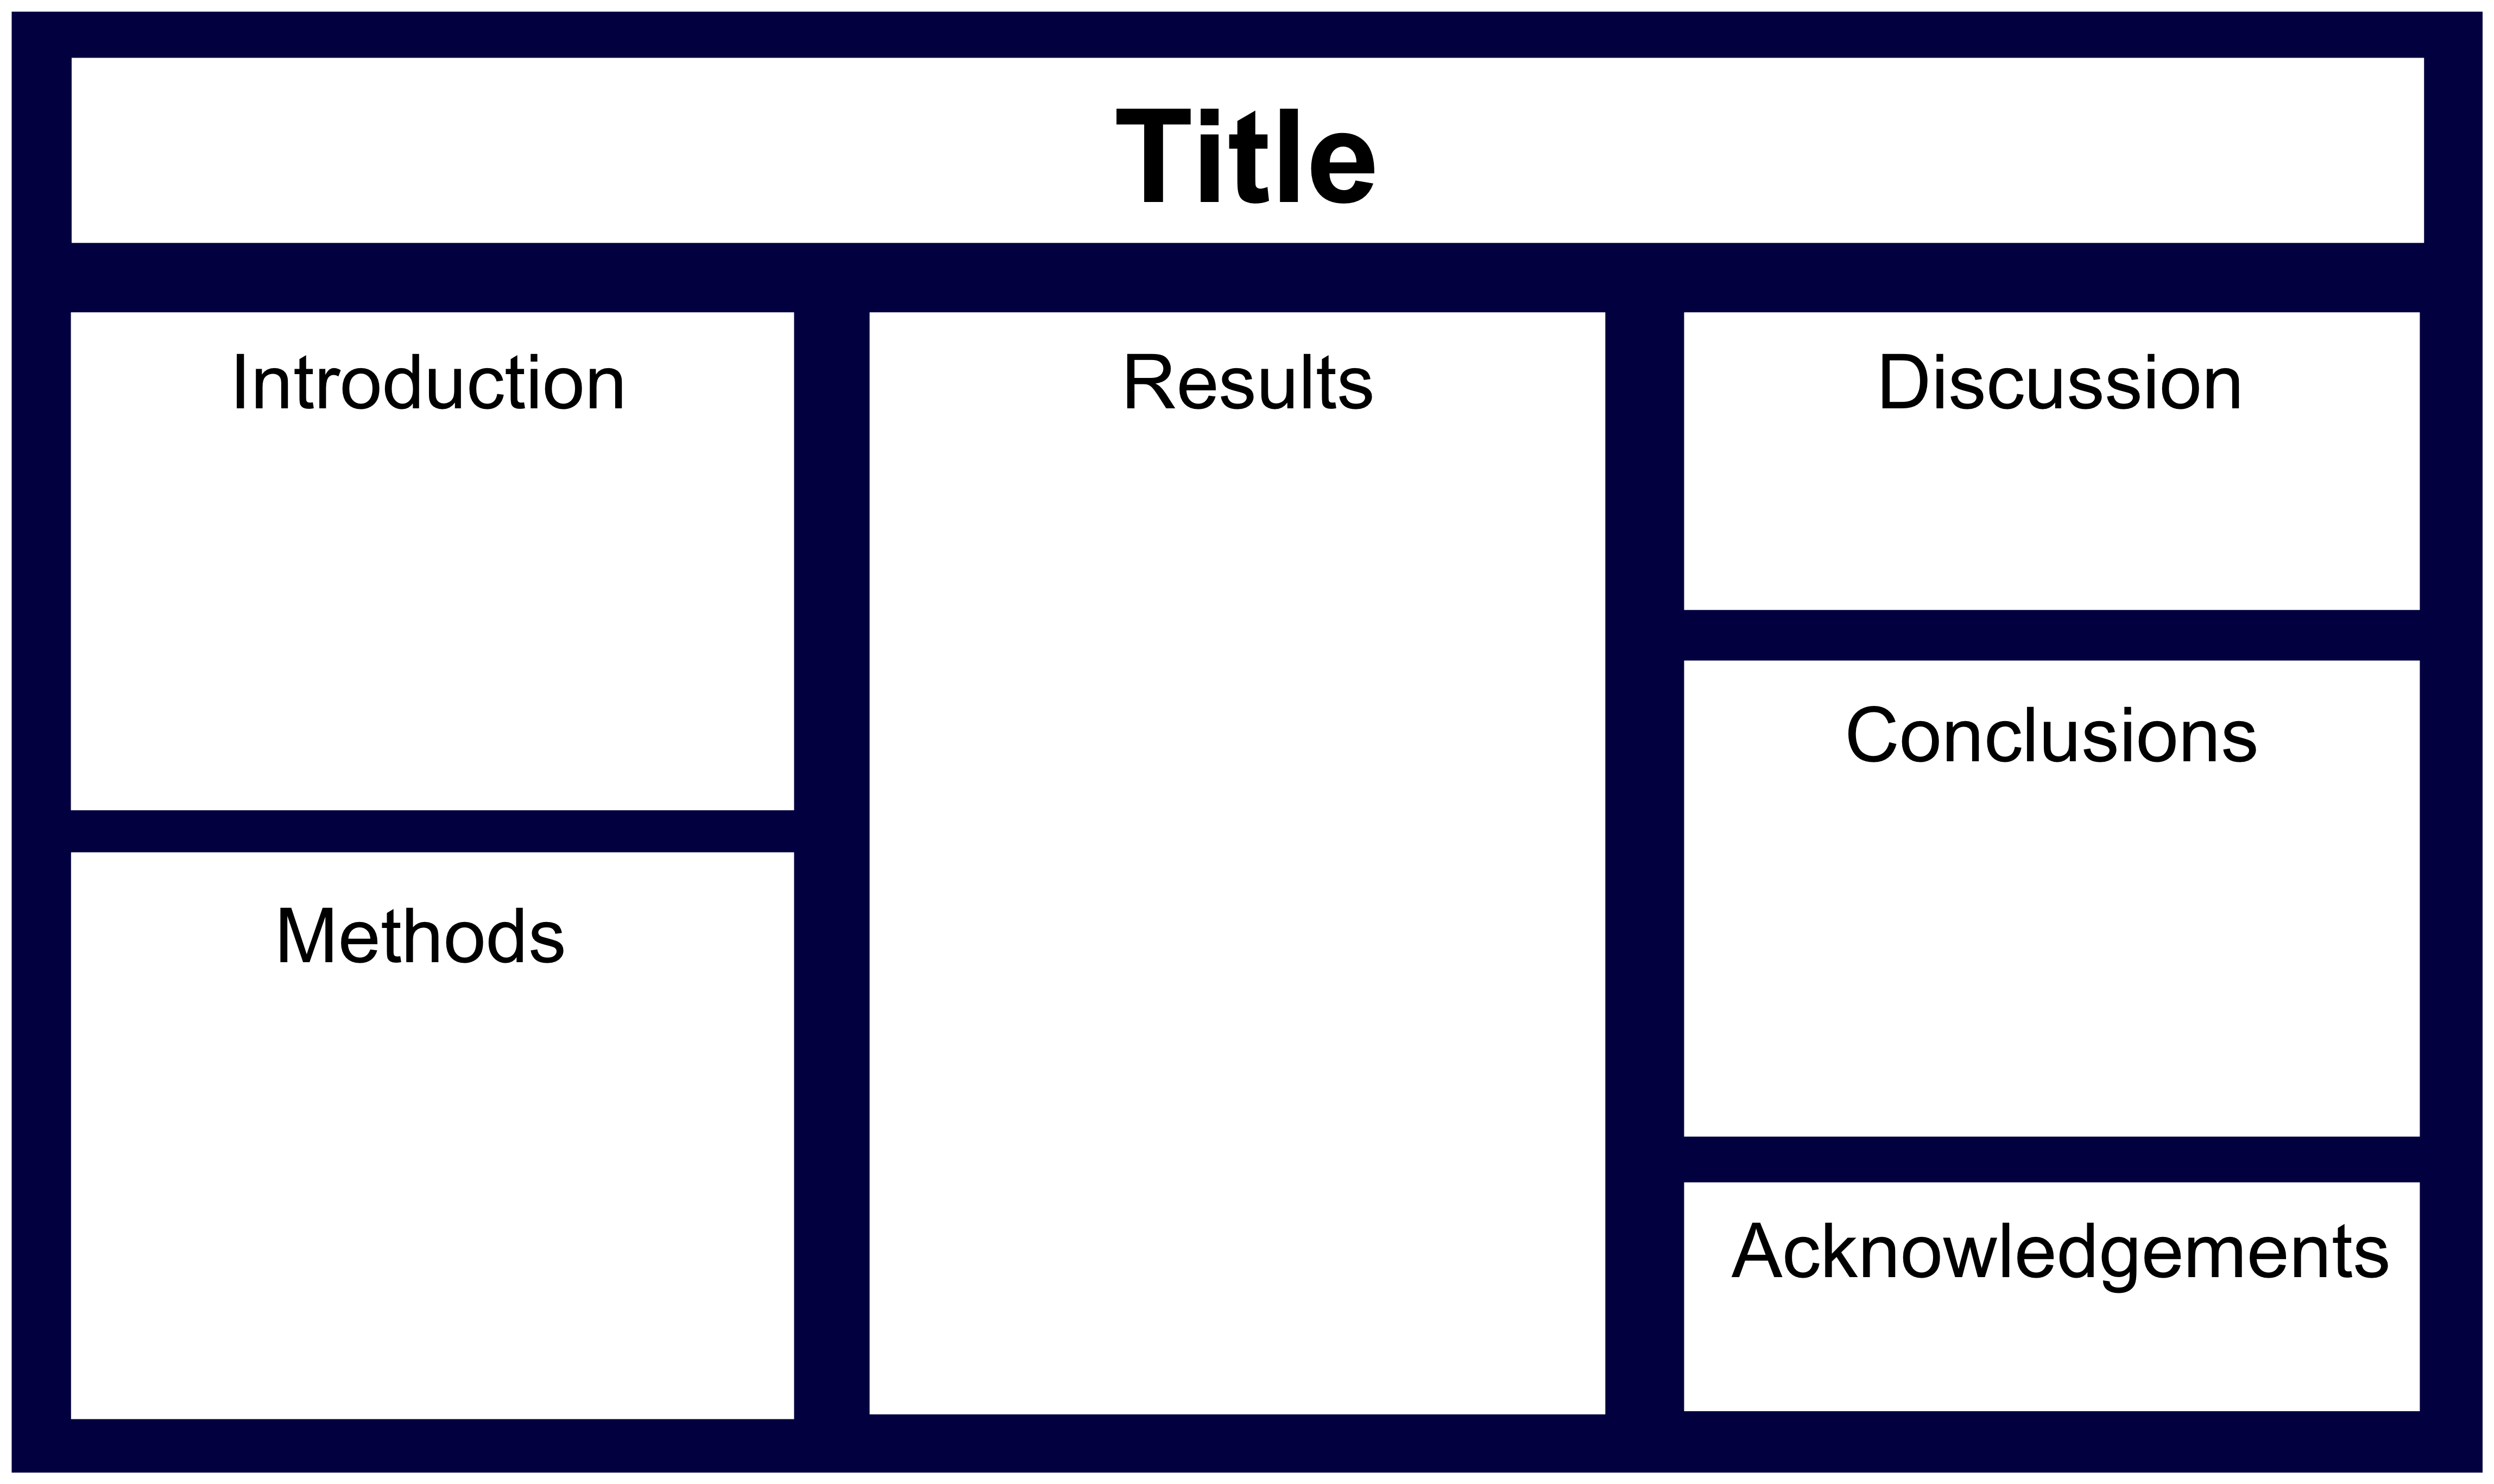
Each column in the 3-column layout reads from top to bottom, starting from the leftmost column and moving to the right. A second common layout uses rows, such as:
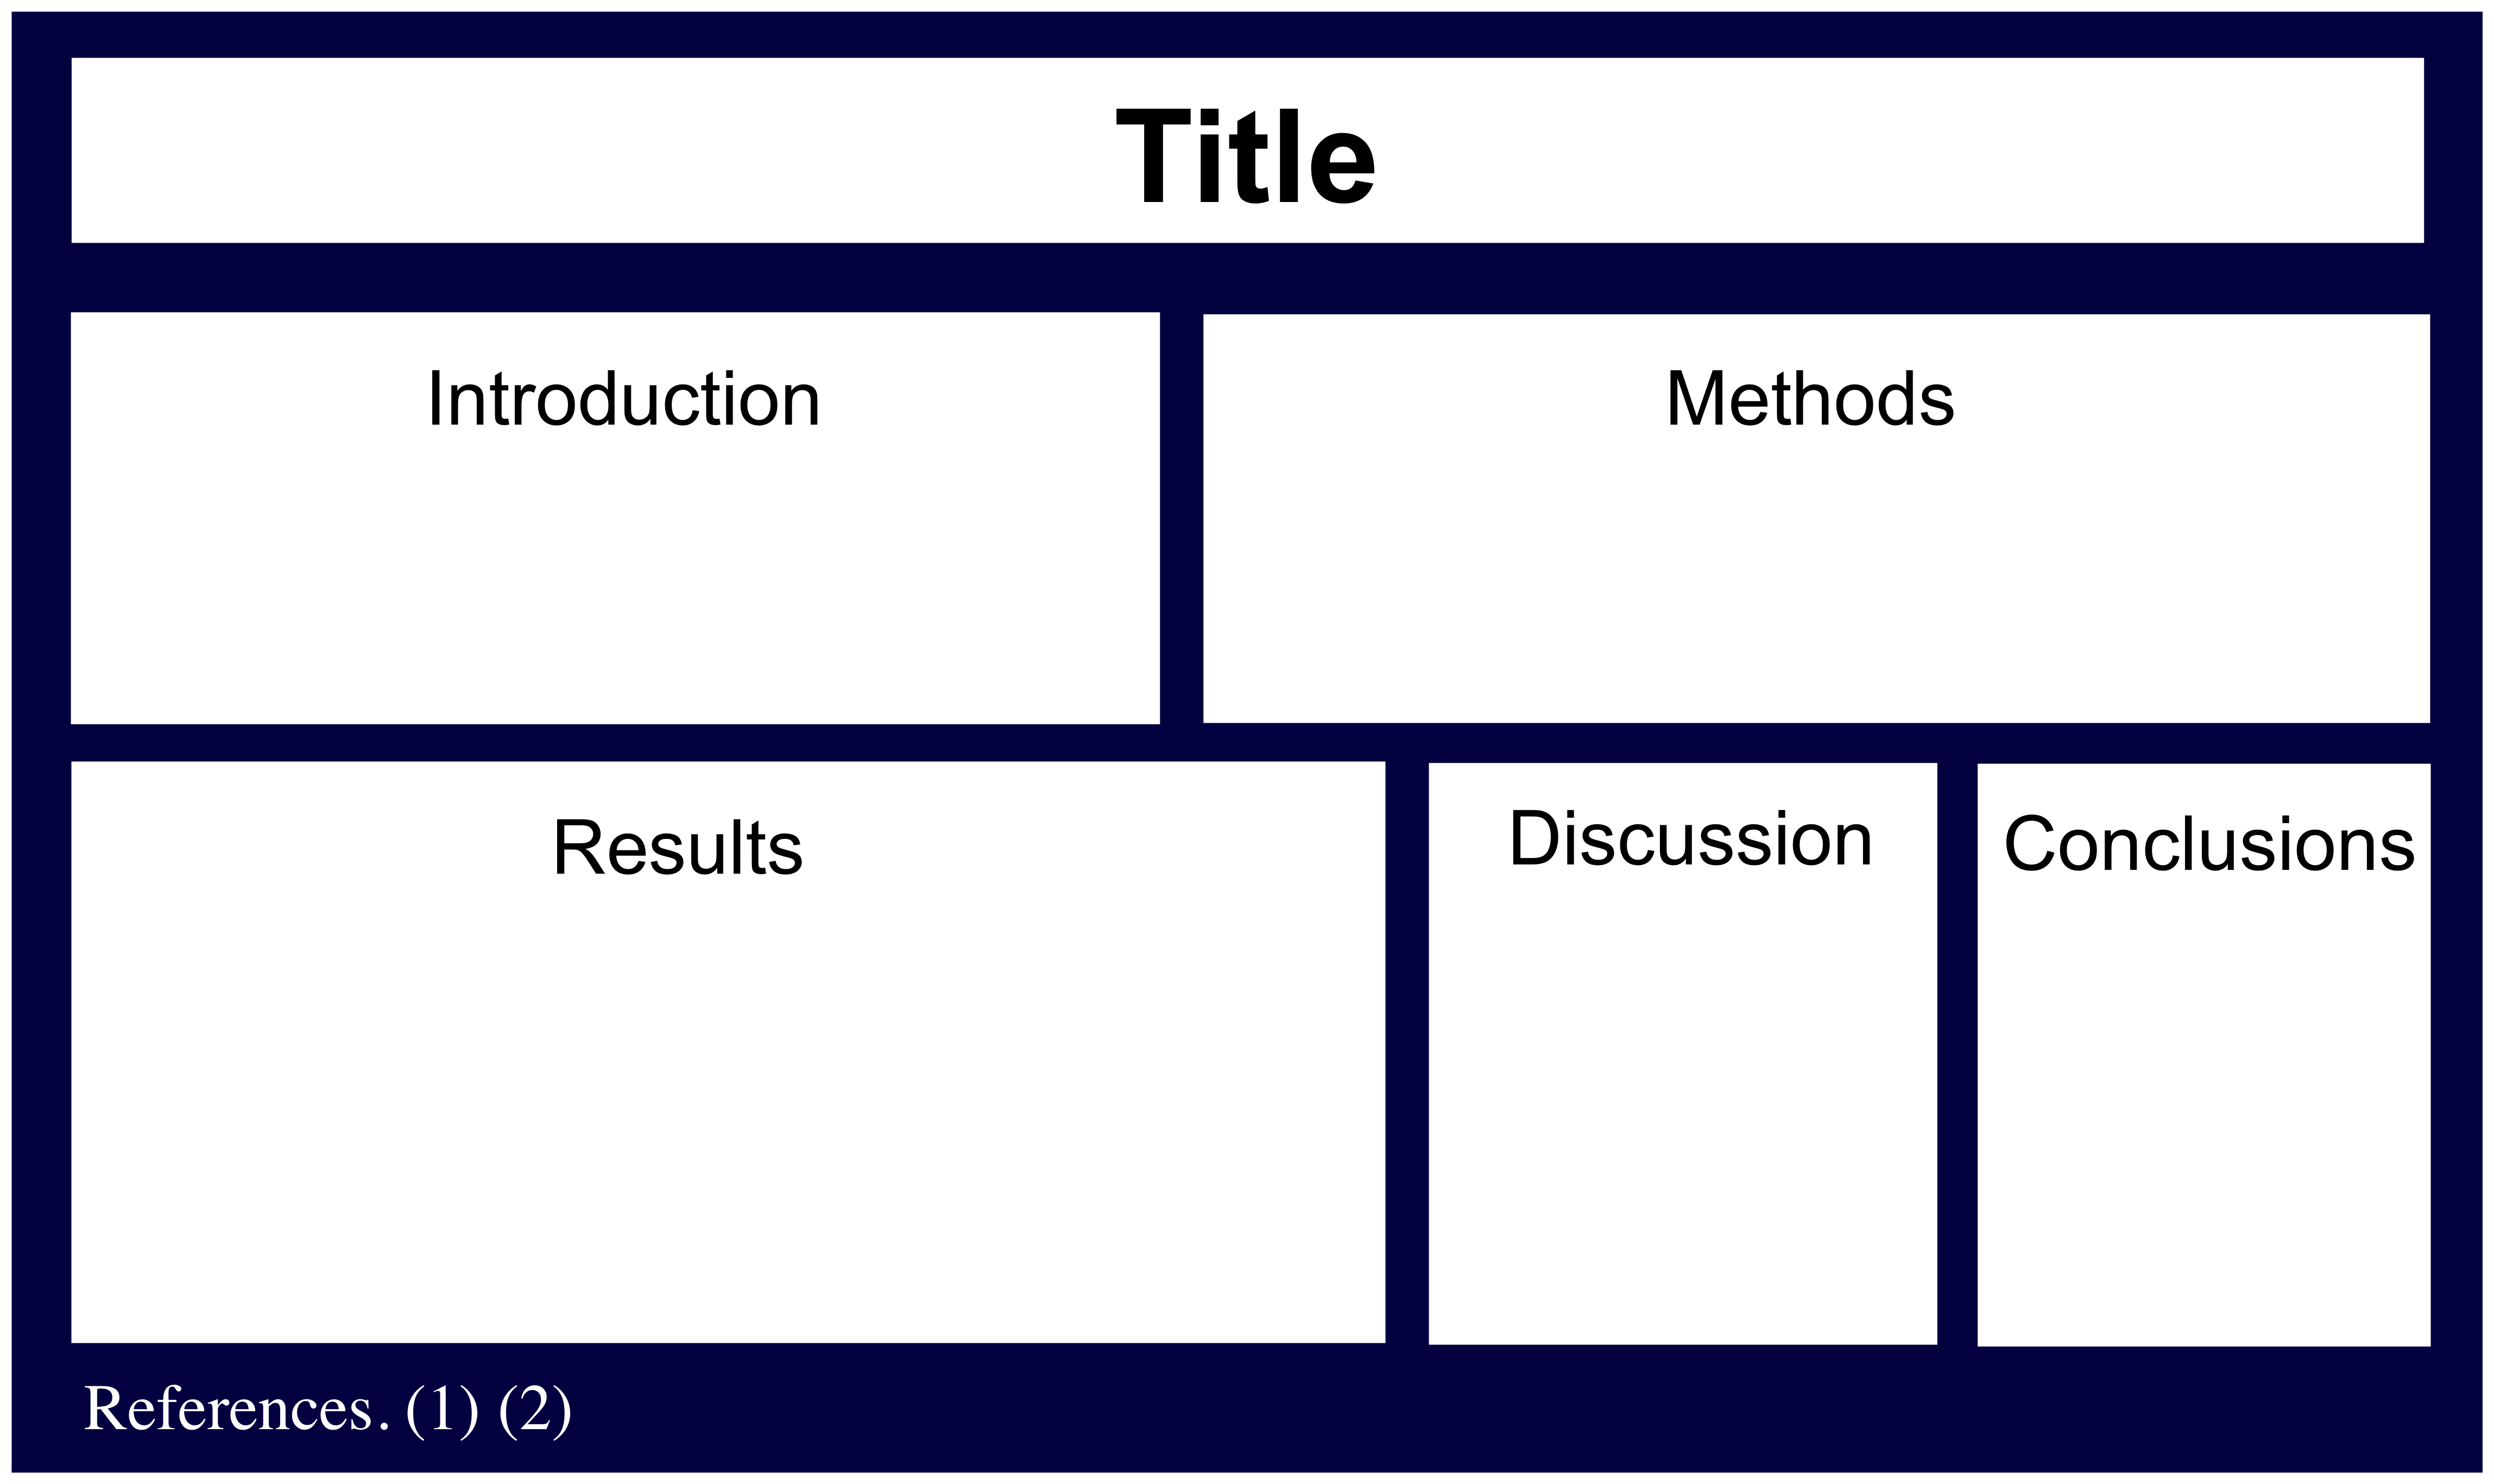
This format can be harder to follow, but does allow you to compare figures side-by-side. You can also use a combination of the row and column formats. However you choose to format your poster, just be sure that it is logical!
Research Proposal
Unlike primary research articles and posters, proposals do not have any conventional format (such as IMRD). The most common way to organize a research proposal is through three major sections:
- Project summary
- Project description
- References cited
Because nearly every funding organization has a different yet exact way they want your proposal to be organized, it is best to research what format the organization you are applying to would like you to use. This information is usually available on websites along with example proposals.
Like in journal articles, separating sections of your proposal with clear headings is important. But because proposals are often even longer and more complex than articles, it is even more critical to maintain an especially clear hierarchical heading format.
[bg_faq_end]
[bg_faq_start]
How do I organize my writing within sections?
Just like following broad organizational conventions help a reader navigate and understand a paper, poster or research article, following specific structural conventions within paragraphs and sections will make your writing more clear and easier to read.
In scientific writing, we call a step you take towards your goal for a certain section a move. Sections and paragraphs are organized by moves, making the overall plan for how you make these moves the section’s move structure. This might be an odd concept at first, but think of it this way: every sentence you write serves some purpose, and is therefore a “move” towards achieving a goal. For example, a move towards introducing your audience to your project might be to tell them what the broad area of research is that your project is a part of.
To start understanding moves and move structures, lets take a non-scientific example: a joke. The goal of a joke is to be funny; everything said in a joke is a “move” towards making it funny. Below is an analysis of the move structure of a joke:
| Statement | Move |
| A man gets into a car accident and breaks his wrist. | Setting the context of the joke. |
| He goes to the hospital, where a doctor puts him in a cast. | Furthering the plot |
| Before he leaves, the man asks the doctor, “Hey, when this is all better, will I be able to play the piano?” | Setting up the punchline |
| “Sure!,” the doctor says. “You’ll be fine in just a few weeks.” | Furthering the plot |
| “Cool! I’ve always wanted to play an instrument.” | Delivering the punchline |
The move structure on the right could be applied to many jokes or used to create new jokes. The same idea applies to scientific writing. In the introduction of a journal article, for example, your goal is to help your reader become familiar with the area of your research and with your specific project. There are a series of moves associated with an introduction that can help get you there. The following is an example adapted from Downes and Solomon (1998):
| Statement | Move |
| Infrared ultraluminous galaxies are recent galaxy mergers in which much of the gas in the former spiral disks has fallen into the center. The large part of the central mass in gas in our universe is ready to turn into stars and fall into a black hole. | Identify the research area |
| The significance of the lower molecular gas mass is twofold. First, it makes the gas mass smaller than the dynamical mass. Second, it means the total molecular gas mass in the ultraluminous galaxies is similar to the molecular mass in the gas-rich spiral. Thus, the nuclear starbursts can be fed by preexisting molecular gas. These ideas show that the kinematics of the nuclear gas is critical to understanding the evolution of ultraluminous galaxies. | Establish the importance of the research area |
| Solomon et al. (1997) observed 37 ultraluminous galaxies with the IRAM 30 m telescope to derive the molecular gas mass by several methods. The minimum estimates of the gas mass did indeed reduce the gas mass to much lower fractions of the dynamical mass. The true gas mass must be between the optically thin CO estimate and the dynamical mass, both of which are less than the gas mass derived with the Milky Way conversion factor for self-gravitating molecular clouds. |
Provide essential background information |
| The CO emissivity per unit gas mass surface density is not constant, but varies with position in the nuclear disk. A more correct treatment requires radiative transfer modeling, with kinematic data from millimeter interferometers. | Identify what’s missing in the literature |
| To carry out this next step in our study of molecular gas disks at the centers of IR ultraluminous galaxies, we made high-resolution CO maps with the IRAM interferometer. | Introduce the current project |
| We introduce our model turbulent rotating disk and discuss the derivations of the rotation curve, disk radius, disk height, turbulent velocity, gas mass, and dynamical mass. We found high turbulence in the molecular disks and that most of the CO luminosity comes from relatively low-density gas. Furthermore, regions of dense molecular gas are regions of extreme starbursts. | Preview key findings |
The above move structure is a little more complicated than that for the joke, but just like for the joke, it can be applied to numerous introductions and help you write your own introduction. The move structures for each section of a paper or poster that you write will be different from one another, but the general idea is the same: taking steps toward achieving your goal for that section.
To see more details about the common move structures for each section of a paper or poster, click on the appropriate section below. Please note that all move structure concepts and diagrams are adapted from Write Like a Chemist (Robinson et al. 2008).
[bg_faq_start]
Journal article
The following move structures apply to experimental articles only. Theoretical or review articles will adopt different conventions, which we will not cover here.
[bg_faq_start]
Abstract
The move structure of an abstract is almost like an incredibly condensed version of your paper. You might have one sentence that acts an “introduction,” one that describes your methods, a few that describe your results, and possibly one that acts like a “discussion.” Below is a diagram that outlines each of the moves you should make in your abstract.
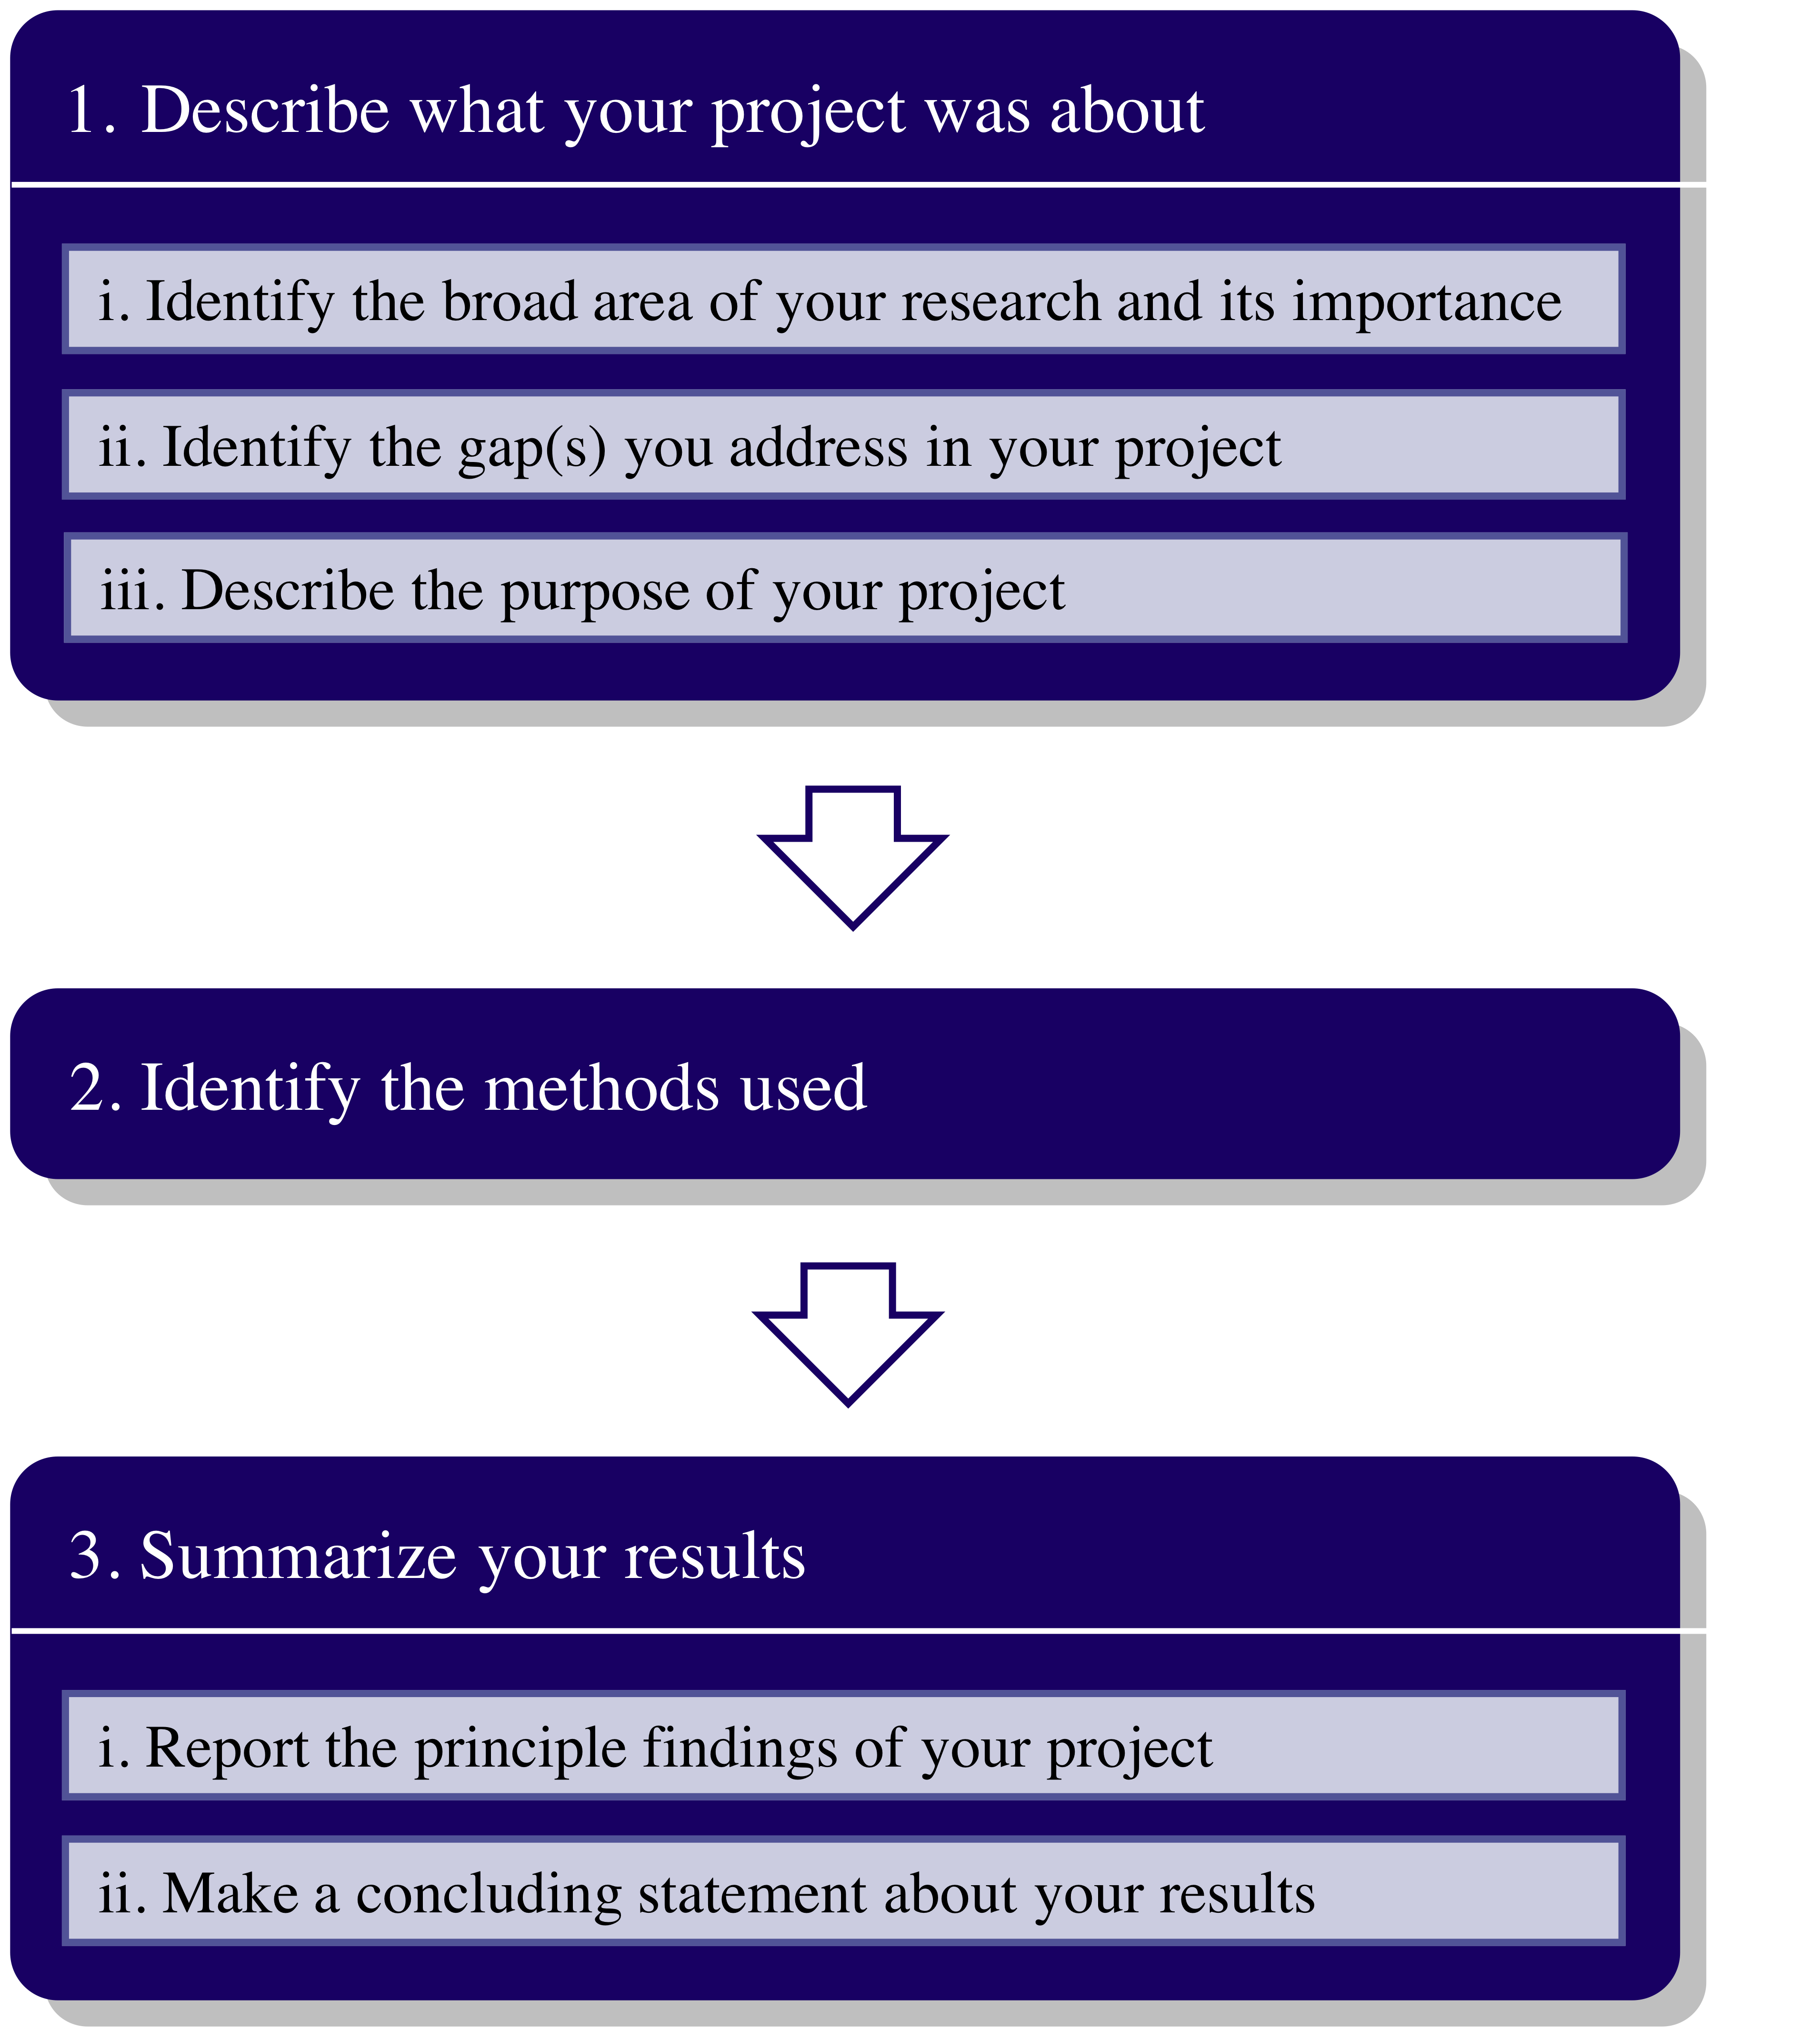
1. Describe what your project was about. The first part of your abstract is what informs your audience of the importance of your project. You’ve already given them an idea of the contents of your paper through your descriptive title, but now you are convincing them in one or two concise sentences that it is worth a read. Move 1(iii) is the most critical of the three submoves, but (i) and (ii) are also good to include to help situate the purpose and accomplishments of your project in a greater context.
|
Below is an abstract from Wallraff et al. (2004). Move 1 is in bold.
The interaction of matter and light is one of the fundamental processes occurring in nature, and its most elementary form is realized when a single atom interacts with a single photon. Reaching this regime has been a major focus of research in atomic physics and quantum optics for several decades and has generated the field of cavity quantum electrodynamics. Here we perform an experiment in which a superconducting two-level system, playing the role of an artificial atom, is coupled to an on-chip cavity consisting of a superconducting transmission line resonator. We show that the strong coupling regime can be attained in a solid-state system, and we experimentally observe the coherent interaction of a superconducting two-level system with a single microwave photon. The concept of circuit quantum electrodynamics opens many new possibilities for studying the strong interaction of light and matter. This system can also be exploited for quantum information processing and quantum communication and may lead to new approaches for single photon generation and detection.
This abstract makes clear the field of research and its importance (submove i). Submoves (ii) and (iii) are more intertwined in the statement: “Reaching this regime has been a major focus of research.” They are saying that no one has yet been able to get a single atom to interact with a single photon (ii) and that they will be attempting to get closer to this goal using cavity quantum electrodynamics (iii).
|
2. Identify the methods used. The amount of detail you provide in this section is largely dependent on the purpose of your paper. If your goal is to analyze the efficacy of a particular instrument in a specific research context, you will probably need to identify the instrument and the basic experimental outline. If the methods you used are commonplace, you might hardly need more than a word or two to identify them.
|
Here is the same abstract from above, this time with Move 2 in bold.
The interaction of matter and light is one of the fundamental processes occurring in nature, and its most elementary form is realized when a single atom interacts with a single photon. Reaching this regime has been a major focus of research in atomic physics and quantum optics for several decades and has generated the field of cavity quantum electrodynamics. Here we perform an experiment in which a superconducting two-level system, playing the role of an artificial atom, is coupled to an on-chip cavity consisting of a superconducting transmission line resonator. We show that the strong coupling regime can be attained in a solid-state system, and we experimentally observe the coherent interaction of a superconducting two-level system with a single microwave photon. The concept of circuit quantum electrodynamics opens many new possibilities for studying the strong interaction of light and matter. This system can also be exploited for quantum information processing and quantum communication and may lead to new approaches for single photon generation and detection.
The authors decided to describe their experimental design for Move 2. Notice that although the design is clearly complex, they have managed to summarize it in one concise sentence that communicates how this experiment relates to their project goal.
|
3. Summarize your results. In this move, you show your readers why your paper is important. If there are specific results or trends that are important, you should identify them specifically by saying, for example, “was 4.23 mg/L” rather than “was higher than expected.” Don’t give your readers an exhaustive list of your results, however–choose the most important findings. Finally, you can conclude your abstract with a summary statement of the possible impact of your findings.
|
Read this abstract again, now taking note of Move 3 (in bold).
The interaction of matter and light is one of the fundamental processes occurring in nature, and its most elementary form is realized when a single atom interacts with a single photon. Reaching this regime has been a major focus of research in atomic physics and quantum optics for several decades and has generated the field of cavity quantum electrodynamics. Here we perform an experiment in which a superconducting two-level system, playing the role of an artificial atom, is coupled to an on-chip cavity consisting of a superconducting transmission line resonator. We show that the strong coupling regime can be attained in a solid-state system, and we experimentally observe the coherent interaction of a superconducting two-level system with a single microwave photon. The concept of circuit quantum electrodynamics opens many new possibilities for studying the strong interaction of light and matter. This system can also be exploited for quantum information processing and quantum communication and may lead to new approaches for single photon generation and detection.
The authors begin with submove (i), summarizing the principle findings of their project. They then dedicate two whole sentences to (ii), in which they explain the importance of the system they utilized. This move could probably be improved by adding why the particular results of their experiments are impactful, while condensing their two concluding sentences into one.
|
Note: Although the moves of the abstract are similar to some of the moves in other parts of your paper (like your introduction and methods, for example), you should avoid directly copying sentences from these sections into your abstract. Instead, take what you know from the paper that you’ve already written and craft new (and hopefully even more concise!) statements for your abstract.
Test yourselfRead the abstract given and identify which sentences comprise each of the major moves (1, 2 and 3) made by the authors. The beginning of each sentence is numbered, such as [1], for easier reference in the solutions.
[bg_faq_start] Solutions
[bg_faq_end] |
[bg_faq_start]
Test yourselfEach of the following sentences are taken out of context from journal article abstracts. Identify the move associated with each statement.
[bg_faq_start] Solutions
[bg_faq_end] [bg_faq_end] |
[bg_faq_end]
[bg_faq_start]
Introduction
The move structure of the introduction always moves from the most general to the most specific information about your project. (In your discussion, you should mirror this pattern so that both the very beginning and very end of your paper connect your project to the greater scientific world.)
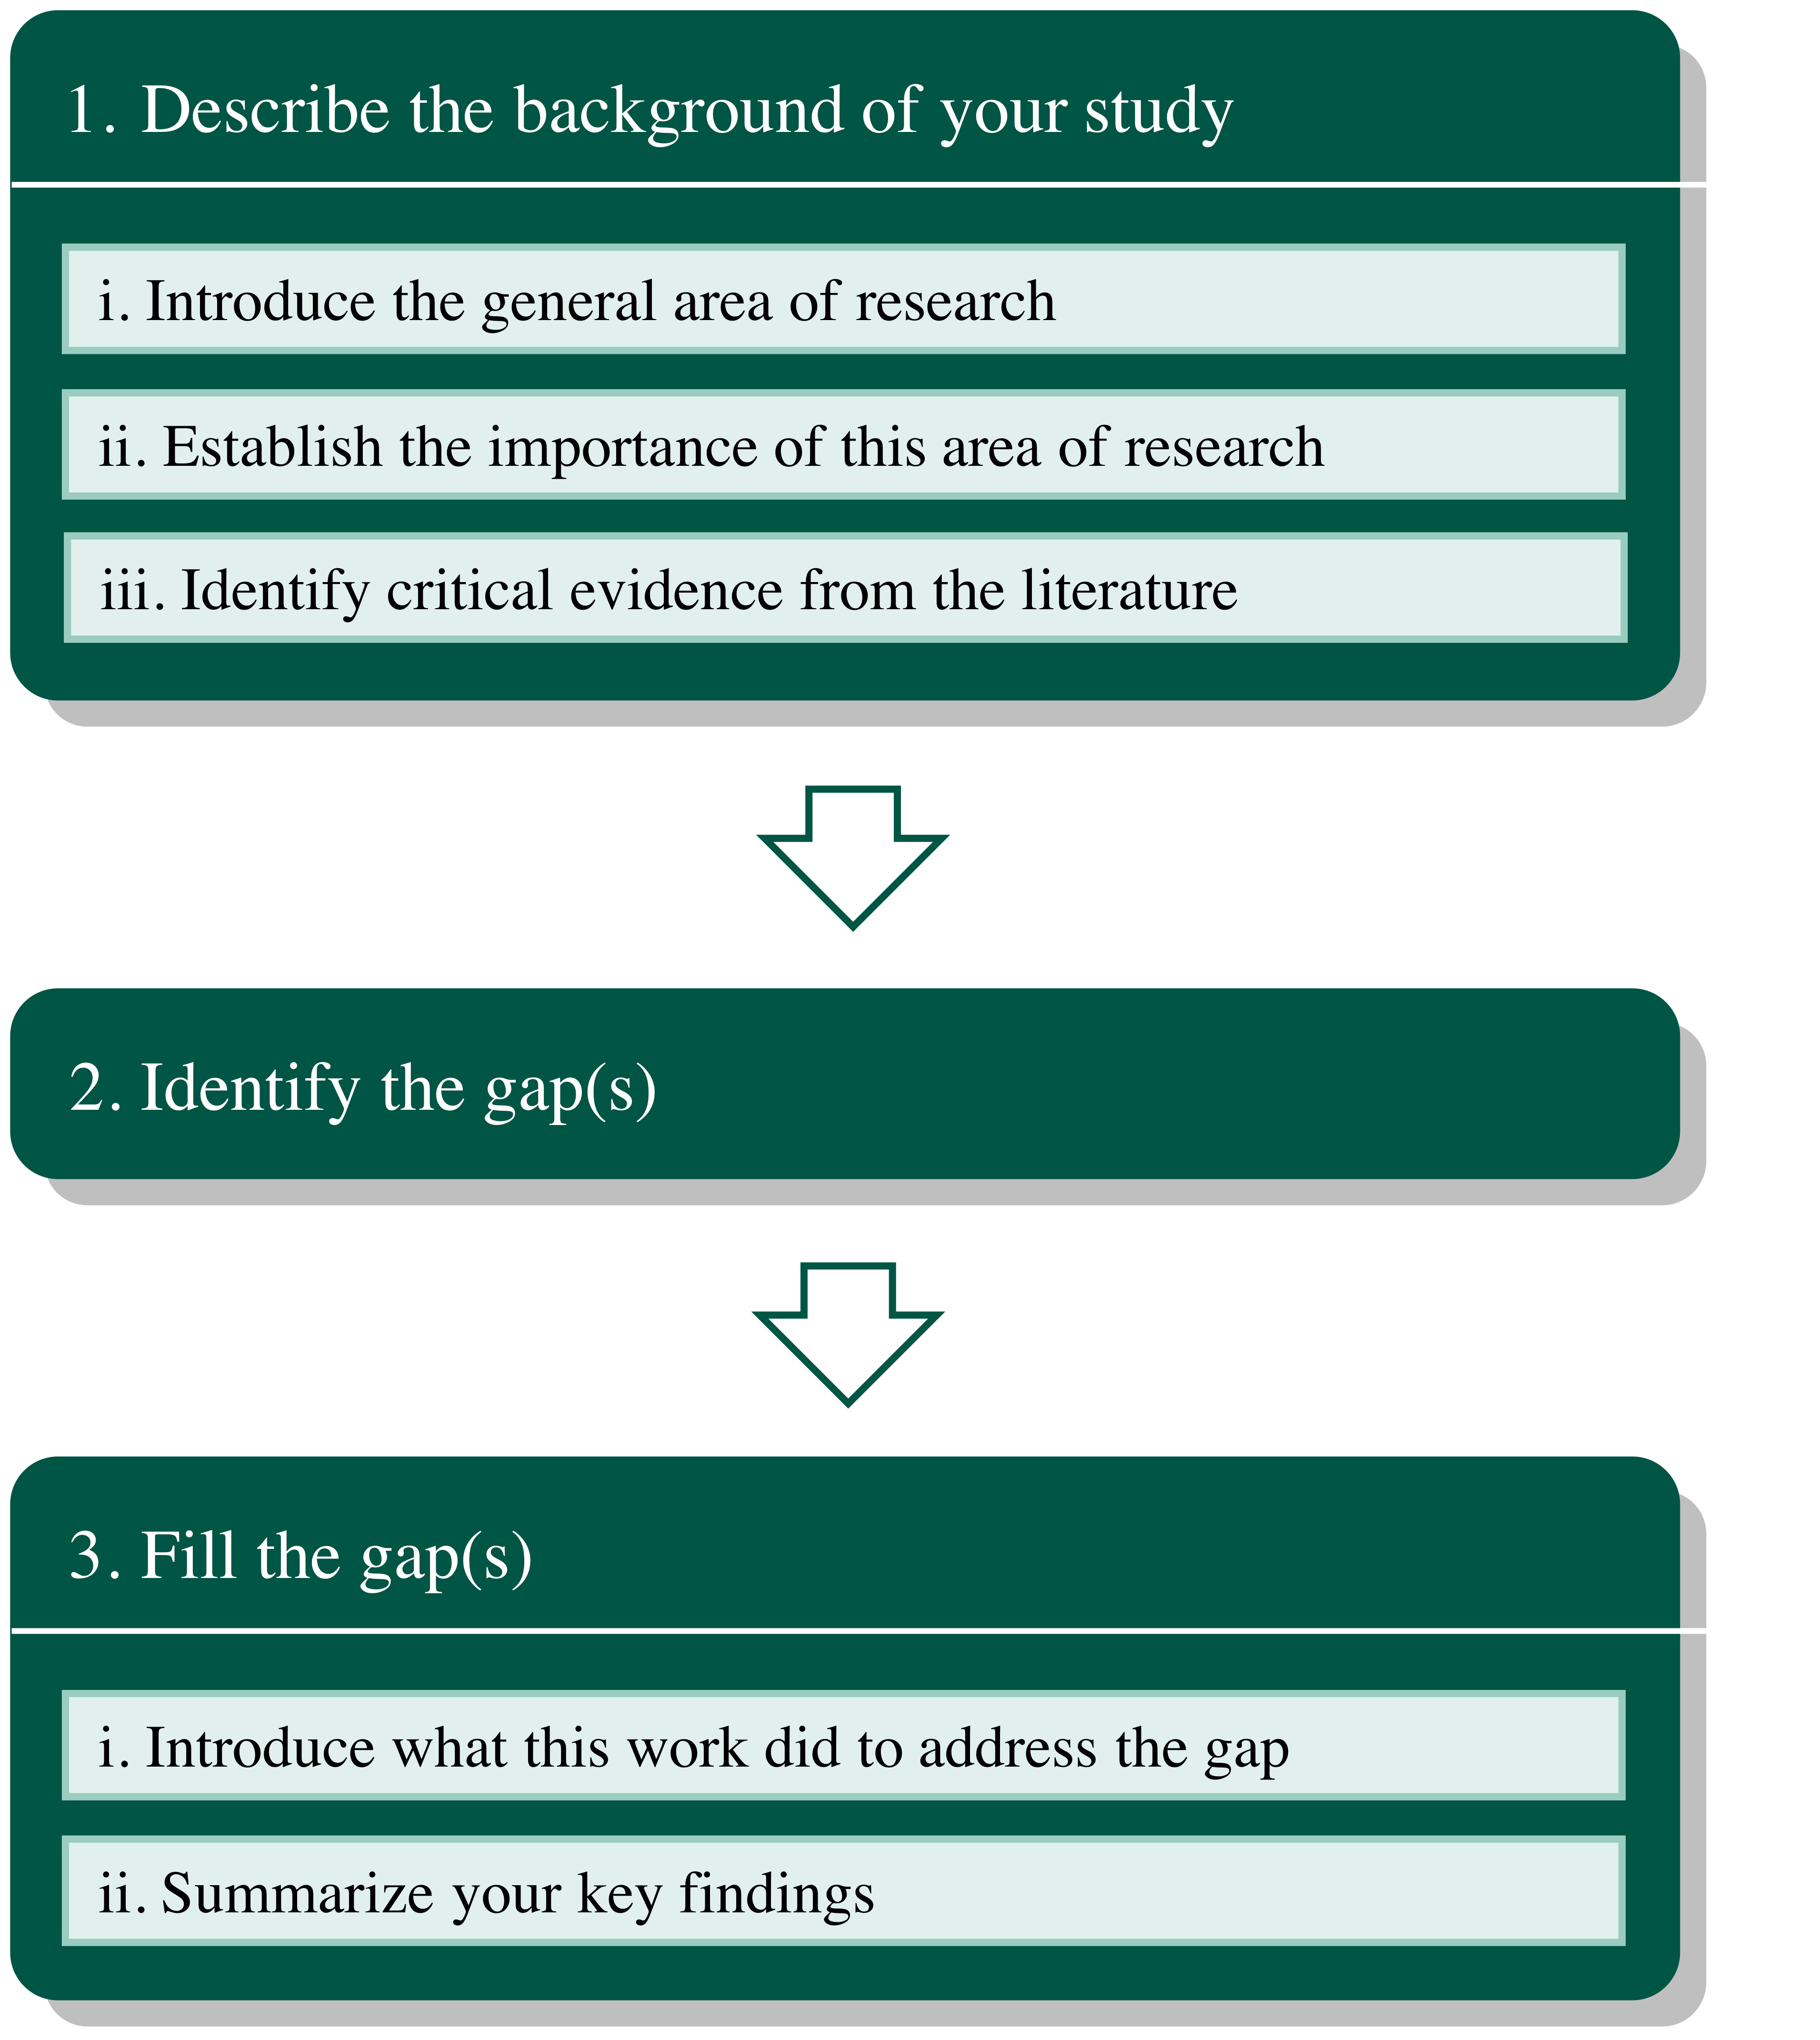
1. Describe the background of your study. Throughout Move 1 you should be citing relevant literature. Submoves (i) and (ii) should only take a sentence or two each, while submove (iii) may consume a couple of paragraphs. Use submove (iii) to situate your specific work within the literature. But remember, this is a very general part of your introduction, so you shouldn’t mention your study yet!
2. Identify the gap(s). Now you can introduce your project by identifying a “gap,” or something that remains to be done or learned considering all of the background you just gave in Move 1.
A gap might be a lack of understanding about how well a particular instrument works in a certain situation. It could be introducing a new method that needs to be tested. Or it could be that you are studying a whole new organism, system, or part of a process.
In a class, you might not always be studying something brand “new.” But you should still try to come up with something unique about your project, however small. Talk to your professor about what they expect for your “gap statement” if nothing seems to work.
|
An example gap from Hosaka, Itao, and Kuroda (1995): “… The relationship between the four damping factors, i.e. internal friction, support loss, airflow force in free space, and squeeze force, has not yet been clarified, so it is not obvious which one is dominant in actual microsystems.” |
Here, the authors signal to us that this is a gap because they use the words “has not yet been clarified.” Other phrases that might help you identify (or form!) a gap statement are:
- …has/have not been… (studied/reported/elucidated)
- …is required/needed…
- …the key question is/remains…
- …it is important to address…
3. Fill the gap(s). Once you identify the gap in the literature, you must tell your audience how you attempt to at least somewhat address this lack of knowledge or understanding in your project. This is often done in a new paragraph and should be accomplished in one summary statement, such as:
Therefore, the purpose of this study was to determine the effects of lead on the hepatobiliary system, especially on the liver and on the gallbladder (adapted from Sipos et al. 2003).
You’ll often find that the first sentence of the last paragraph in a paper’s introduction will start somewhat like this, indicating the gap fill.
Some phrases you can use to indicate your gap “fill:”
|
Remember–always keep your voice professional! Colloquial phrases such as “we looked into” or “we checked if” should be avoided when introducing your gap fill.
So let’s look at this idea in context by looking at some examples from a couple of types of papers. The gap statements are underlined; the fills are italicized.
| Adapted from Monthioux et al. (2001):
Though ideally expected to be chemically very stable due to the poor reactivity of the basal aromatic plane from which SWNTs are built, the question of whether all the chemicals which are now currently proposed in the literature as purifying, suspending, or grafting agents for SWNTs actually have a limited effect on the SWNT integrity has to be addressed. In this paper, we report the investigation of the effects of some commonly used chemical treatments on SWNT structure by means of high resolution transmission microscopy (HRTEM). We also report the effect on purified SWNTs of an organic solvent, dimethylformamide, used to tentatively prepare SWNT suspension. Adapted from Zhang, Dawes, and Walker (2001): Milly’s work recognized the importance of storage capacity of the root zone in controlling evapotranspiration and has the postential for assessing the catchment-scale response of vegetation changes. However, the practical application of this model is limited because of the complex numerical solutions required. The purpose of this paper is to quantify the long-term impact of vegetation changes on mean annual evapotranspiration at catchment scales based on data and parameters that are easily measurable at a regional scale. Adapted from Lecoanet, Bottero, and Wiesner (2004): A risk assessment of the potential impacts on health and environment that the production, use, and disposal of nanomaterials may engender requires information concerning both the potential for exposure to a given material and its (once exposed) potential impacts such as toxicity or mutagenicity. In this work, we address the issue of nanomaterial exposure and transport in experiments designed to assess their potential for migration in porous media such as groundwater aquifers and water treatment plant filters. |
In the second and third examples, the gap may be a little less obvious–it doesn’t use any phrases to signal to you that there’s something missing, such as “has not been clarified” or “have not been reported.” But because of the way the paragraph is laid out–following the conventions of our move structures–we can see that the underlined section of text is indeed the missing information in the literature that the group sought to address in their project.
Org-3: Test yourselfIn the following examples, identify the gap statement. Then, identify the fill. Notice if there are any specific words or phrases used to signal either of these moves. 1. Adapted from Costa, Robertson, and Quilliam (2015): Paralytic shellfish poisoning occurs worldwide, and harmful algal blooms, including those responsible for PSP, appear to be increasing in frequency and intensity. PSP outbreaks in Portuguese waters have been associated with blooms of Gymnodinium caenatum in the late 1980s to early 1990s, then again after 2005. According to the national monitoring program in Portugal, G. catenatum were not reported along the Portuguese coast during the 10-year period from 1995 to 2005. The aims of this study were to fully characterize the toxin profile of G. catenatum strains isolated from the NW Portuguese coast before and after the 10-year absence of blooms to 2. Adapted from Littler, Ciringh, and Lindsey (1999): The exchange process frequently observed in polypyrrane condensations is proposed to occur by the acid-catalyzed fragmentation of a polypyrrane 1 into pyrrolic 2 and azafulvene 3 components.15 As illustrated in Scheme 2, recombination of 2 and 3 can form a new polypyrrane 4 that cannot be formed by direct condensation of the dipyrromethane and aldehyde. Ultimately this process leads to the production of a scrambled mixture of porphyrins. The factors that promote the scrambling process in MacDonald-type 2 + 2 condensations are poorly understood, but suppression of scrambling is essential for preparing large quantities of pure trans-porphyrins. In this paper we describe a study of a wide range of reaction conditions for the 2 + 2 condensation that has led to refined synthetic procedures for the preparation of trans-porphyrins. 3. Adapted from Pukhov and Meyer-ter-Vehn (2002): In the present paper, we focus on laser wake field acceleration in a new, highly non-linear regime. It occurs for laser pulses shorter than λ(p) but for relativistic intensities high enough to break the plasma wave after the first oscillation. In the present relativistic regime, one should notice that the plama wave fronts are curved and first break new the wave axis and for lower values than the plane-wave limit. This has been studied in 2D geometry in [14-17]. Here, we present 3D PIC simulations of two representative cases. The case (I) is just marginally above and the case (II) is far above the breaking threshold. [bg_faq_start] SolutionsGood gap and fill signaling phrases are italicized.
1. Gap statement: “The factors that promote the scrambling process in MacDonald-type 2 + 2 condensations are poorly understood….” Fill: “In this paper we describe a study of a wide range of reaction conditions for the 2 + 2 condensation that has led to refined synthetic procedures for the preparation of trans-porphyrins.”
2. This question is a little trickier! The authors use “In the present paper…,” then, “In the present regime…,” and finally, “Here…,” all of which sound like signaling words for filling the gap. But where is the gap? We have to look closely at what exactly is being said. It is true that the first statement appears to be somewhat of a gap fill, although they haven’t yet given us a gap statement. The authors go on to say “This has been studied in 2D geometry,” which brings us back to move 1(iii), identifying critical evidence from the literature. Thus, the gap statement is not explicit. It is a combination of stating that this concept has been studied in 2D, followed by announcement that the authors will study it in 3D. Although the first sentence (“… we focus on laser wake field acceleration…”) could also be considered part of the fill, because it comes before the gap statement and is also less descriptive, it functions more as an introduction to these moves.
3. Gap statement: “According to the national monitoring program in Portugal, G. catenatum were not reported along the Portuguese coast during the 10-year period from 1995 to 2005.” Fill: “The aims of this study were to fully characterize the toxin profile of G. catenatum strains isolated from the NW Portuguese coast before and after the 10-year absence of blooms to
[bg_faq_end] |
Org-4: Practice exerciseFind 3-4 primary research articles (not reviews) from reputable journals in your field. Underline the gap statement and circle the gap fill. Remember that not all papers follow this exact move structure, so if you can’t seem to find either of these moves, you might have to look carefully at different parts of the introduction and ask yourself:
|
[bg_faq_end]
[bg_faq_start]
Methods
The goal of a methods section is to describe how a project was conducted in sufficient detail that a fellow expert could replicate the work; thus, the moves used in the methods section are very specific. However, because of the nature of different types of projects, the move structure of this section may look very different between disciplines.
Note that the Methods section is only applicable to an experimental article. In theoretical articles, such as those published in many physics journals, the introduction is often directly followed by an explanation of the theory. Physics papers in general are the least likely to follow a general methods move structure; individual journals should be consulted for preferences. In many geology articles, a section detailing the location of the experiment or observations is sometimes included before the methods section.
Here is a common move structure for an experimental Methods section:

Each major move can be divided further into sub-moves through the use of subheadings that categorized the different types of materials, instrumentation, or numerical methods, as appropriate. Alternatively, it may sometimes be appropriate to group your methods such that you repeat sets of Moves 1, 2, and 3 for each part of your project. This can sometimes make your methods section more clear and is often used in organic chemistry articles.
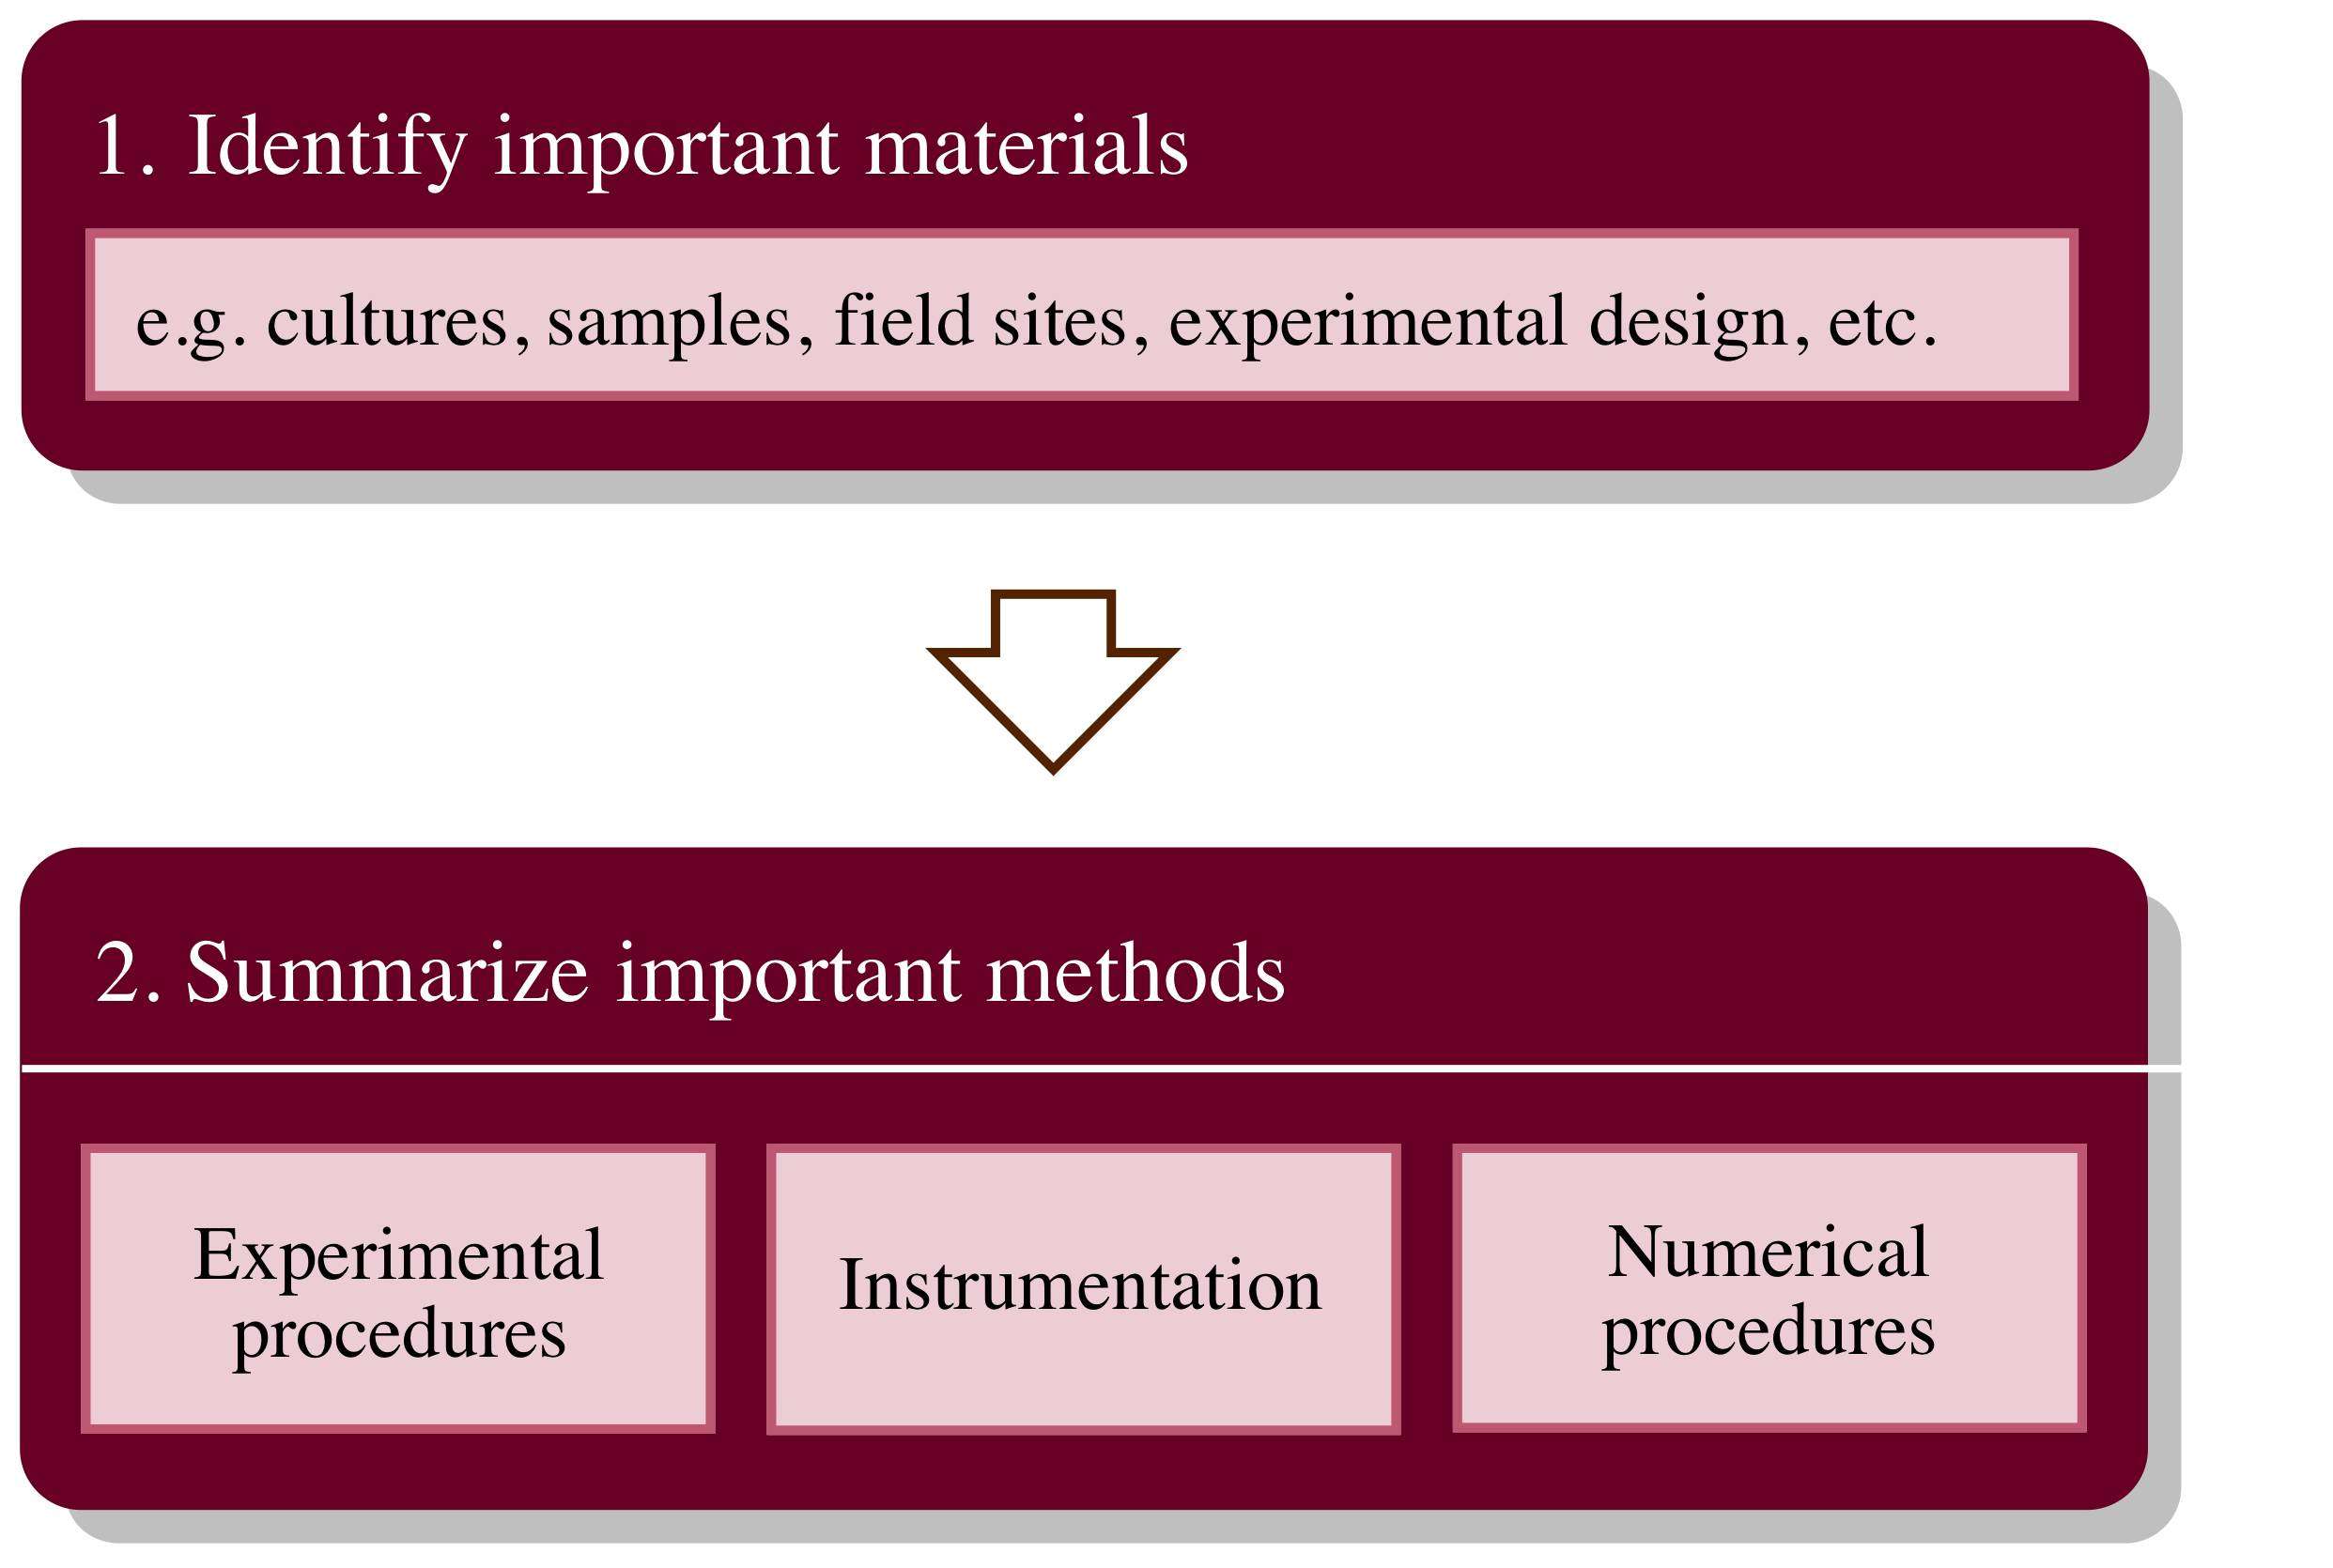
1. Describe materials. In the first move, you should mostly list (in full sentences!) the items you used to conduct your experiments. In an experimental physics paper, the experimental setup/design can sometimes be considered Move 1. Remember that you need to provide as much information as necessary for an expert to repeat your project–this means that you will probably need to provide every detail you have about an organism you are studying but minimal details about a general reagent you used to sterilize your glassware. Depending on the project, you might only need a single sentence to complete Move 1 or have no need for Move 1 at all, in which case your Methods section can start with Move 2.
| Examples of Move 1 Adapted from Tripathi, Kaur, and Jyoti (2015): 2.1. Chemicals used Cadmium acetate (Cd(CH3COO)2) and benzene were purchased from Qualigens fine chemicals. Sodium sulfide (anhydrous purified) and ammonia were purchased from Merck Specialities Pvt. Ltd. Polyvinyl pyrrolidone (PVP) and polystyrene (PS) were obtained from Sigma Aldrich. Deionized water was used in all experiments and all of the other chemicals were of analytical grade and used as purchased without any further purification. Adapted from Ghiraldini, Crispim, and Mello (2013): Animals Female NOD/Unib and BALB/cAnUnib mice were obtained from the Multidisciplinary Center of Biological Investigation of the University of Campinas. The animals were reared under standard controlled conditions, fed extruded chow (Nuvital, Colombo, Brazil), and provided water ad libitum. |
2. Describe experimental methods. This move is used to describe how results were obtained. This might involve both experimental procedures and specific instrumentation, which should be described in the order they were conducted in your study. Experimental procedures include field sample collection, synthetic procedures, modeling parameters, quality assurance/quality control (QA/QC) procedures, and anything else that was used to obtain the results of your project. Like in Move 1, the move structure here is highly variable across disciplines.
3. Describe numerical methods. In this move, you should describe any statistical or otherwise mathematical manipulations your conducted on your data to obtain reported results. If none were conducted, this does not need to be stated explicitly, and you can omit Move 3 altogether. If the data analysis of each part of your procedure was conducted differently, it may be appropriate to follow each sub-section of Move 2 with Move 3, then repeat as needed. The key is that manipulation of your results should follow the collection of the results, just as they do in your project.
|
Examples of Move 3 Adapted from Ghiraldini, Crispim, and Mello (2013): All statistical analyses were performed with Minitab 12 software (Minitab, State College, PA). Data comparison between the diabetic animals and their controls from five independent sets of experiments was performed by means of the analysis of variance (ANOVA) test, and for pairwise comparison Student’s t test was used. p < 0.05 was considered the critical level for rejection of the null hypothesis. Adapted from Campos et al. (2015): Data for elastic modulus and flexural strength were analyzed using one-way ANOVA/Tukey’s test. For both tests, the global significance level was 5%. Regression analyzes were performed to |
Remember that the construction of your methods section relies completely on how the work itself was conducted. This means that the order of your sub-moves should imitate the order of your procedures, which is why Move 1 (describe materials) precedes Move 2 (describe procedures) and Move 2 precedes Move 3 (describe numerical methods): usually, you must obtain your materials before using them for experiments, after which you will analyze your data with numerical methods. Furthermore, if, for example, your procedure only involved calculations, you probably won’t have a “describe materials” move, and your experimental procedures will be your numerical methods.
| In an article by Johannsen et al. (2015), the methods section is called “Computational Details” and only includes details about how and why they used certain mathematical manipulations. |
[bg_faq_start]
Org-5: Test yourselfEach of the following sentences are taken out of context from journal article abstracts. Identify the move associated with each statement.
[bg_faq_start] Solutions
[bg_faq_end] |
[bg_faq_end]
[bg_faq_start]
Results
One of the most easy-to-understand ways to group information in the results section is to group results into smaller chunks. That way, instead of having to absorb results all at once, your audience can be introduced to and consider your results in manageable and sensible chunks. So if, for example, you collected two different types of data, you might want to introduce and discuss one set of data before doing so with the other.
Although it isn’t related to organization, it is worth mentioning here anyway: remember that the results section is for presenting data, not to draw conclusions from it! You can combine these techniques only if you use a “Results and Discussion” section or similar broad organization pattern. Double check that you never discuss the implications of your data unless you are supposed to.
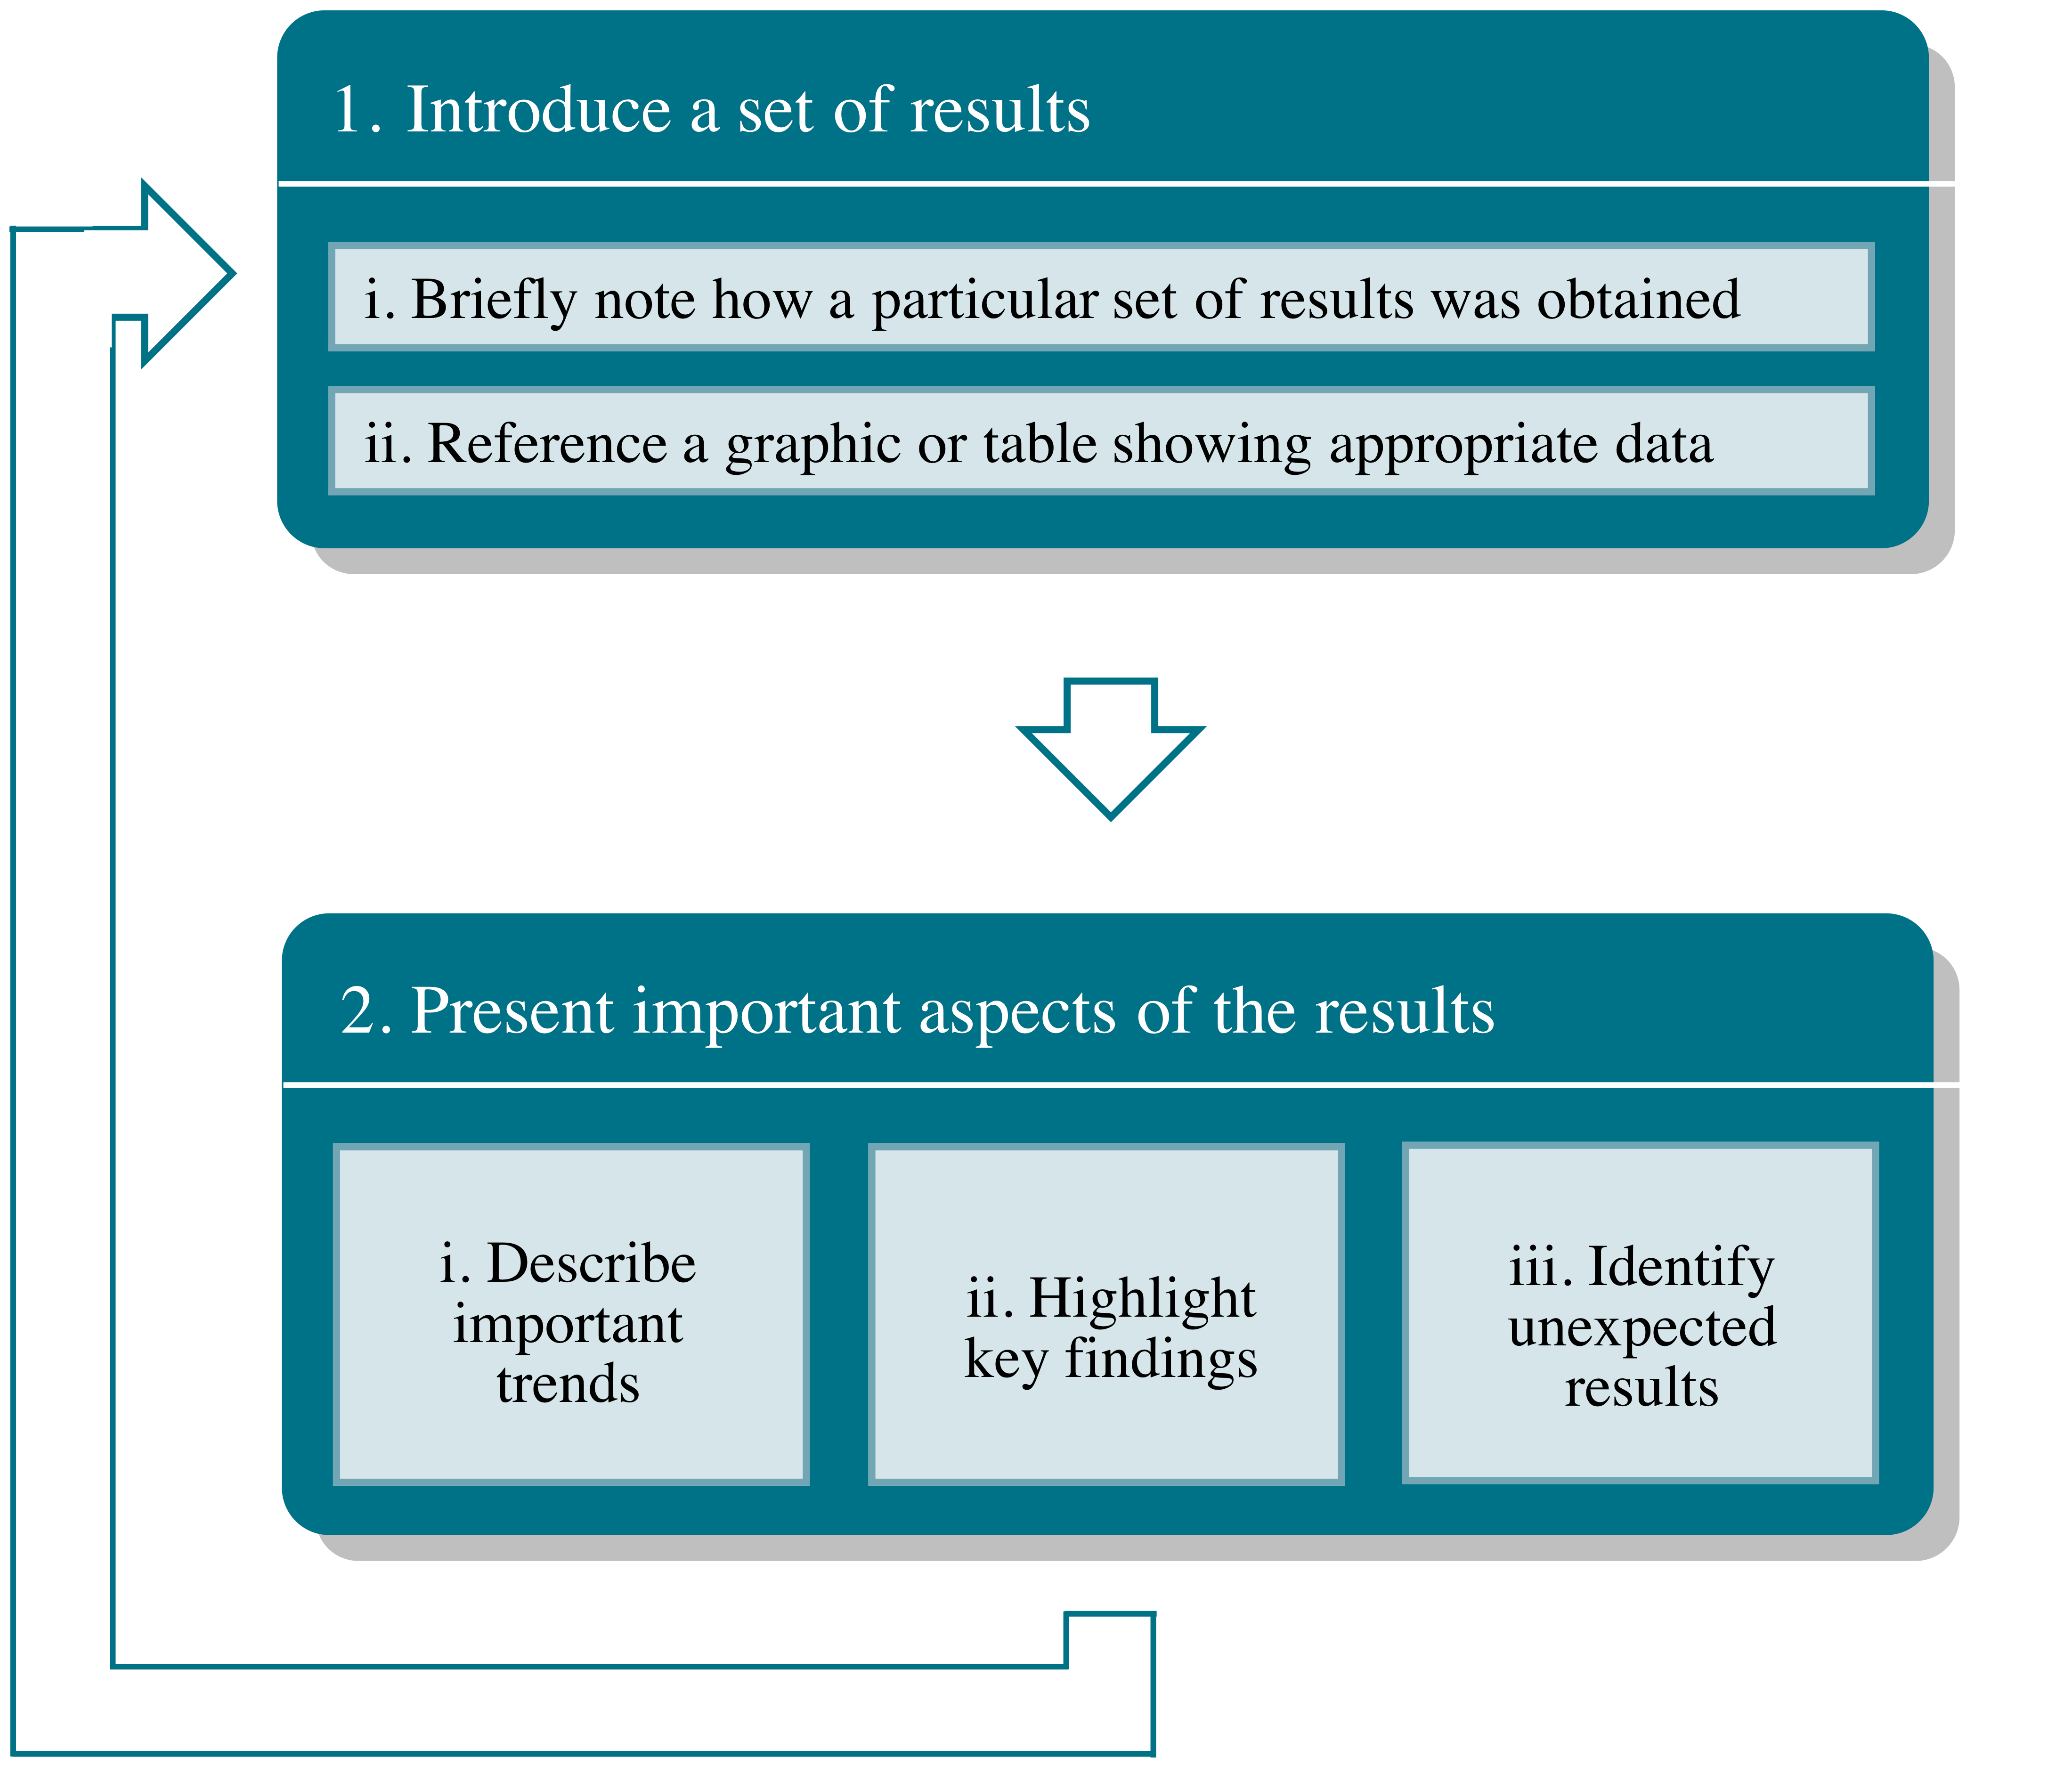
1. Introduce a set of results. This move transitions your reader from your methods to your results. It is helpful to briefly (no more than a sentence or two) remind your reader how you obtained a set of results so that someone could read your results section out of context and still be able to understand them. Below is an example of how part of a Methods section can be condensed into a summary sentence in the Results section.
| An excerpt adapted from the Methods section of Costanza-Robinson and Brusseau (2002):
The media was uniformly mixed with the desired amount of water and packed wet into the column. The porous medium was tamped in the column at small increments, typically 1-cm, to minimize the formation of particle-size layering in the column. Aliquots of the wet porous medium were collected before and after packing to gravimetrically determine initial water contents. After the experiment, the column was unpacked and a small (<20 g) aliquot was taken from near the column inlet, three points along the axis of flow, and near the column outlet for gravimetric water content measurement. Move 1(i) of Results: Miscible displacement experiments were conducted at nine water contents ranging between 2% and 20%. |
In submove (ii), you should refer your reader to a figure or table, if you are using one, that presents the data from this part of the experiment, such as the following excerpt from Weill et al. (2014):
Figure 6 shows the evolution of the cumulated erosion and deposition (in millimeters) during Exp_10 (Fig. 2, Table 2).
For conciseness, however, it is often preferable to combine submoves (i) and (ii). Here we provide a few examples of all of Move 1 accomplished in a single sentence.
| Adapted from Campos et al. (2015):
The results of the flexural modulus and flexural strength of previously-photopolymerized and irradiated groups are presented in Table 3. Adapted from Caputo et al. (2012): Thin layer chromatography (TLC) analysis of uninoculated medium containing L-phenylalanine (0.05%) revealed an optimal separation of the amino acid with a retention coefficient (Rf = 0.57±0.01) comparable to that obtained by the L-phenylalanine standard (Figure 2). Adapted from Costa, Robertson, and Quilliam (2015): The profile of PSTs in a cultured strain of Gymnodinium catenatum isolated from Cascais Bay in 2007 and a seawater sample collected during a bloom of G. catenatum off Aveiro also in 2007 was characterized via HILIC-MS/MS (Figure 4). |
2. Present important aspects of the results. In this move, you are using the results you introduced in Move 1 to tell a scientific story. What are the trends in the data? What data stand out (either because they confirm previous suspicions or refute them)? The order in which you describe each important part of your results is up to you, but you should do it in a way that makes sense with the graphics you present and the importance of the data. Consistent with the “broad-to-narrow” approach (see our section on broad organization), authors will often present an entire section of results and then describe in more detail only those that turned out to be most interesting.
| Examples of complete Results move structures (Move 1 is underlined in the following excerpts; Move 2 is left unstyled) |
| Adapted from Katti et al. (2015):
Molecular dynamics simulations were performed on a double stranded rice plant DNA in the absence and presence of single walled carbon nanotube. Fig. 1(b) and (d) show the conformation of DNA in model-1 and model-2 after 10 ns of simulation. The presence of SWCNT strongly influenced and altered the conformation of DNA in model-2. The conformational changes in DNA were observed within few ps of simulation; however, wrapping of DNA onto the SWCNT started after 1 ns. Fig. 2(a)–(c) show the wrapping of DNA onto SWCNT at the time period of 1, 5 and 10 ns, respectively. As seen in these figures, DNA wrapping onto the SWCNT begins from the one end and moves towards the other end. It was observed that the fourteen base pairs in solvated DNA–SWCNT model have unzipped after 10 ns. Fig.1(d) shows that the unzipping mechanism of the DNA base pairs is more prevalent closer to the SWCNT. Adapted from Ledda-Columbano, Columbano, and Pani (1983): Preliminary studies carried out in our laboratory indicate that a single dose of 5 Mmol/100 g body weight of lead nitrate is able to induce DNA synthesis, as measured by the incorporation of labeled thymidine into hepatic DNA. Maximal activity of DNA was reached 30-36 hours after lead treatment; an increase in liver mass and total hepatic content of DNA at 2-3 days after treatment, with a return to normal values at 7-8 days after the administration of the metal, was also observed (data not shown). Adapted from Hou et al. (2007): In response to picture stimulus (mining accident related pictures versus neutral pictures), the PTSD group showed significant activations in the left posterior cingulate gyrus, the bilateral caudate and the right thalamus and significant deactivations in the right cingulate gyrus and the bilateral middle frontal gyrus. Control subjects showed significant activations in many brain areas (Table 1). |
[bg_faq_start]
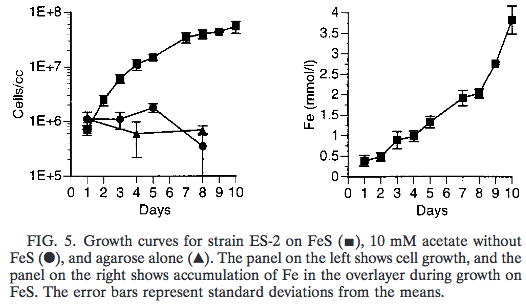
Org-6: Practice exerciseIn a paper by Emerson and Moyer (1997), the authors describe an experiment in which they attempt to grow two different iron-oxidizing bacterial strains, ES-1 and ES-2, on various mediums . Below is an excerpt from this paper with an accompanying figure. Read the excerpt and answer the following questions:
The growth curves of strains ES-1 and ES-2 are shown in Fig. 4 and 5, respectively. ES-1 grew on FeS with a doubling time of approximately 8 h. The addition of acetate to the growth medium did not appear to stimulate the growth of ES-1 above that of Fe2+ alone. When ES-1 was grown in the presence of agarose alone it did not show any sign of growth (Fig. 4). When it was grown in the presence of acetate, pyruvate, or glucose without added iron, there was no visible sign of growth. Strain ES-2 grew on FeS with a Both strains required vitamins for growth; when the vitamins were omitted their growth diminished markedly after two or three transfers. If bicarbonate was omitted from the medium and 10 mM HEPES buffer was substituted as a buffer at pH 6.5, it also appeared that the growth of the strains was diminished, as judged by the slower than normal formation of a growth band. [bg_faq_start] Possible solutions
[bg_faq_end] [bg_faq_end] |
[bg_faq_start]
Org-7: Test yourselfEach of the following sentences are taken out of context from journal article Results sections. Identify the move associated with each statement. Also try to identify the sub-move, if you can!
[bg_faq_start] Solutions
[bg_faq_end] |
In combined Results & Discussion sections, the move structures can often look very much the same as those described above, with the addition of an interpretive statement(s) as a “Move 3.” For example, here is the first part of a combined section adapted from Neubauer et al. (2015):
The measurements were taken under a constant current of 0.23 mA using a 980 nm wavelength laser. Fig. 3 displays the light intensity dependence on the photovoltage on a log–log scale. At the measured intensities the photovoltage increases linearly with the light intensity. The experimental results could be fitted to a simple power law equation, Pαpβ, where P is the photovoltage, p the light intensity, and the β the power law index. Our best fit for the β value is β = 0.72.
Note how the first sentence accomplishes Move 1(i), the second Move 1(ii), and the following sentences Move 2. At the end of this paragraph, the authors added the following:
We believe that the surface effects of the GaAs are the major reason for the deviation from the ideal slope value, 1.
This final statement attempts to interpret the results they just presented.
[bg_faq_end]
[bg_faq_start]
Discussion
Remember how the introduction to a work begins with a broader topic and then narrows its focus to the work at hand? (If not, click here!) In the discussion, we mirror this organizational structure by discussing the specifics of our results before looking at the project as a whole and, finally, how the project might influence to the greater world.
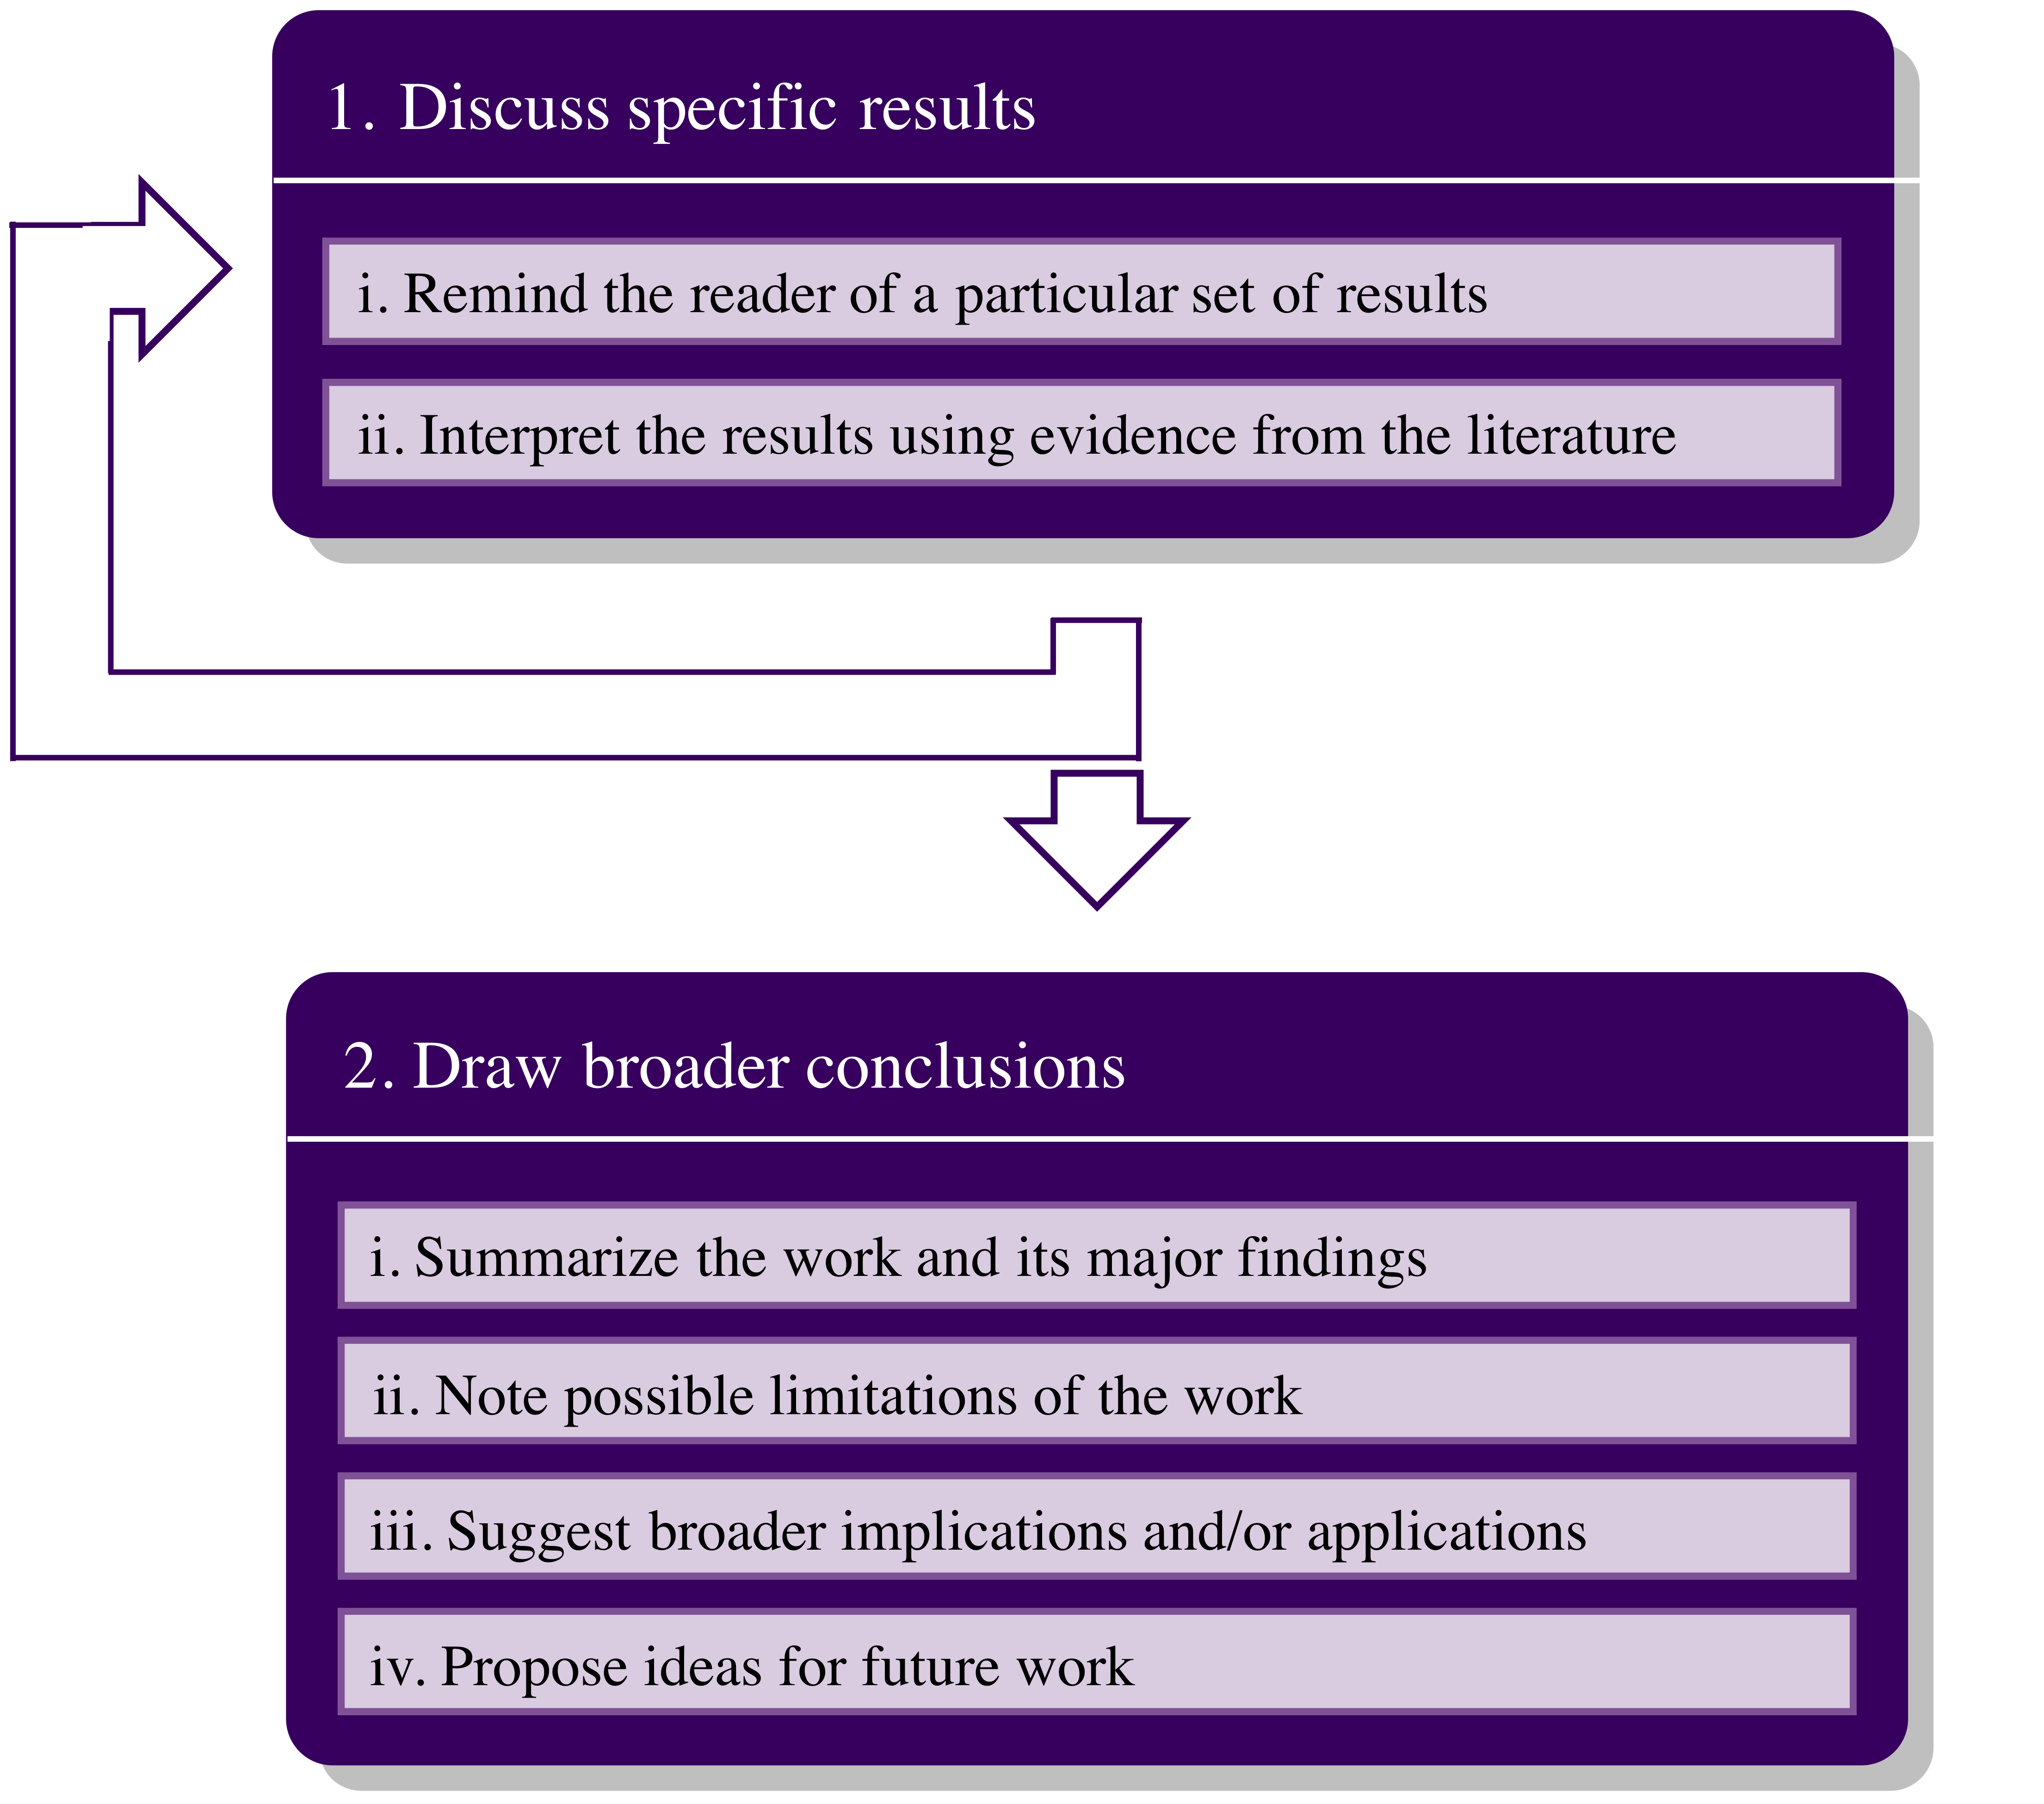
1. Discuss specific results. For the sake of clarity and consistency, you should discuss results in the order in which you presented them in your Results section. You should spend only a sentence or so accomplishing sub-move 1, reminding your reader of a set of results before discussing it. (In a combined Results and Discussion section, you can skip sub-move (i) altogether; instead, after presenting a particular set of results, make Discussion Move 1(ii) before presenting the next set of results. And repeat!)
|
An example of Move 1(i) 1(i) is in bold and is followed by 1(ii). Adapted from Laws et al. (2000): All of the test chemicals evaluated were capable of inducing an uterotrophic response within 3 days in the prepubertal Long Evans rats. Based upon the dose-response data for 4-ter-octylphenol and 4-nonylphenol, the 3-day uterotrophic assay in the prepubertal rats was the best indicator of estrogenic activity when compared with the age at vaginal opening in prepubertal rats, estrous cyclicity in intact adult rats or changes in vaginal cytology. |
Sub-move (ii) is arguably the most important part of your published paper and is certainly the meat of your discussion section. Because in broad terms the goal of your project should be to contribute to a greater understanding of a broader scientific concept, your discussion should connect your project to those of others by considering how your work supports, refutes, expands, or otherwise connects to previously published work. It is critical that you avoid “hand-waving” arguments in which you make claims about your results that have little scientific evidence to support them.
Repeat Move 1 for each result you think is important to discuss. Usually, each subsequent Move 1 iteration is begun in a new paragraph. Some results can be grouped together by discussing trends or patterns in the data; this strategy should be obvious if you already have identified data in such groups in your Results section. Remember to gradually broaden the focus of each paragraph as you move throughout your Discussion, if possible.
2. Draw broader conclusions. This move allows you to broaden the scope of your paper again to the general scientific work. If it comprises multiple paragraphs, sometimes all or part of Move 2 is sequestered to a separate Conclusions section. In this section you should attempt to answer such questions as: What should other scientists consider when thinking about the impact of your paper, including its limitations and applications? What do you think should be done next to further the accomplishments of your project? Although not every one of these sub-moves is necessary depending on your discipline and project, this move is critical for showing the importance and meaningfulness of your work. As usual, the more concise and scientifically grounded you are throughout this move, the more convincing your writing will be. It will greatly help your reader here to tie your conclusion back to your introduction, showing your reader how you finally addressed your gap.
Org-8: Test yourselfEach of the following excerpts are taken out of context from journal article Discussion sections. Assuming each excerpt as a whole accomplishes Move 2, identify which of the four sub-moves is accomplished by each sentence. Note that not every excerpt will contain all of the sub-moves. (Sentences are numbered with italicised superscript numerasl for reference in the Solutions.) 1. Adapted from Steelman, Kennedy, and Parker (2015): 1 The riverbed along the Eramosa River is an intermittently-exposed bedrock surface, where groundwater and surface water are variably connected through networks of open and sediment-filled discrete fractures and conduits. 2 The identification of epikarst partially covered by fluvial sediment and its relationship to the formation open and exposed fracture conduit networks and suspected sinkholes, advanced our understanding of hydraulic and temperature responses in the shallow bedrock aquifer. 3 Our ability to estimate physical properties of the bulk rock formation to 15–20 m depth using GPR resulted in a better understanding of hydraulic conditions and aquifer properties across the study area, improving our understanding of spatial variability of advective pathways along this river system. 4 The approach used in this study could be used to construct larger-scale 2D layer models of shallow groundwater aquifers enhancing the development of local flow models capable of assessing groundwater–surface water dynamics. 5 While our geophysical approach was effective in detecting the position and frequency of vertical and subvertical fracture zones and exploring the general characteristics of a bedrock river system, it did not provide direct evidence of the mechanisms governing spatial variations in bedrock riverbed features (e.g., buried channels, fractures and conduits, sinkholes) or their hydrogeologic significant to the local flow system. 6 Based on the available geophysical, hydrogeological and geological information, we suspect that lateral variations in erosion-resistant layering (e.g., fine-grained, well-cemented, thinly-laminated rock) are likely controlling channel morphology, as well as the occurrence and development of discrete fracture networks and conduits which transiently control surface water–groundwater connectivity from low to high stage periods. 7Nevertheless, this initial work represents a basis for future studies aimed at characterizing groundwater–surface water exchange patterns in a bedrock river environment. 2. Adapted from Mottaleb, Woo, and Kim (2001): 1 In ELCAD-AES analysis, a stable glow discharge plasma could be obtained by applying 1-2 kV in an atmospheric air pressure and a several mm discharge gap between the Pt rod anode and electrolyte solution cathode. 2 Spectrum emitted from waters contained basic atomic lines of dissolved metals and OH bands peaks. 3 The intensity of spectral lines depends on the operating parameters such as pH of the electrolytes, discharge current and discharge gap. 4 The LOD values of Hg, Pb, Cd, Cu, Na and K were found in the range of 0.001-0.08 mg/l. 5 The LOD values of Hg, Pb, Cd and Cu were improved by more than one order of magnitude compared to closed-type ECLAD. 6 The applicability of ELCAD-AES has been assessed for fresh milk analysis. 7 The concentrations of different metals such as Cu, Pb, Fe, Mn, Ca, Zn, Mg, Na and K found in drinking water and fresh milk support the WHO and Korean Environmental Protection Agency guidelines. 8 Finally, this technique could have potential and effectively be used for analysis of other liquid samples such seawater, fruit juices, etc. 3. Adapted from Stensvold et al. (2015): 1 Future studies should monitor the prevalence, distribution, and host specificity of Babesia in ticks from different geographical regions in Denmark and neighbouring countries in order to increase awareness and to enable assessment of the potential public health risk of contracting babesiosis in this region where infections may be emerging. 2 Furthermore, it should be investigated, to which extent patients with Lyme disease are seropositive for Babesia. 3 Low diagnostic sensitivity related to traditional diagnosis of acute babesiosis can be overcome by the use of Babesia-specific PCR, suitable for direct detection of the pathogen in blood samples from patients with relevant exposure and unexplained fever. Conclusion 4 This study is the first to detect of B. microti in Danish ticks. We confirmed the presence of B. microti in I. ricinus collected at multiple locations in Denmark. 5 Our data evinces endemic occurrence of potentially zoonotic Babesia in Denmark and confirms I. ricinus as a vector of multiple pathogens of public health concern. 6 Awareness of the potential impact of Babesia on public health in Scandinavia could be increased by monitoring the prevalence, distribution, and host specificity of Babesia in ticks. 4. Adapted from Pukhov and Meyer-ter-Vehn (2002): 1 In this work we have considered the wake field acceleration of electrons in the broken-wave regime. 2 This kinetic and highly non-linear regime is difficult to treat analytically, and therefore we have studied it numerically. 3 We find that the 3D wave breaking of the laser wake field can produce electron bunches with unique properties. 4 A sub-10-fs laser pulse with only 20-mJ energy is able to accelerate 109 electrons with a flat spectrum reaching 50-MeV energy. 5 A spectrum sharply peaked in energy is obtained for a 12-J, 30-fs laser pulse. 6 In this case the laser is intense enough to expel all background electrons from the first wake trough, forming a solitary cavity and a completely broken wake field further downstream. 7 Propagating through plasma, this cavity continuously traps a small portion of background electrons and generates an almost mono-energetic beam of 3 × 10¹⁰ electrons at 300 MeV. 8 These new results call for experimental verification. 9 At present we have to rely on our 3D PIC simulations. 10 However, we recall that PIC simulations have been very successful in reproducing existing experiments [12, 14, 34]. 11 The fast development of laser technology suggests that the laser pulses with corresponding parameters will be available in the near future. [bg_faq_start] Solutions1. Sentences 1-3: Move 2(i) Sentence 3: Move 2(iii) Sentence 4: Move 2(iv) Sentences 5-6: Move 2(ii) –although sentence 6 isn’t exactly identifying a limitation of the project, it is further explaining the limitation identifyed in sentence 5. Sentences 7: Move 2(iii) 2. Sentences 1-5: Move 2(i) Sentences 6-8: Move 2(iii) 3. Sentences 1-3: Move 2(iv) Sentence 4: Move 2(i) Sentence 5: Move 2(iii) Sentence 6: Move 2(iv) –yes, again! Here they decided to sum up the future work in one concise, overarching statement, which helps broaden their discussion back out at the very end of their paper. 4. Sentences 1-7: Move 2(i) Sentence 8: Move 2(iv) Sentence 9: Move 2(ii) Sentence 10-11: The end to this paper is unconventional. The authors make an effort to further validify their results by explaining the accuracy of the method. This kind of discussion might be better suited to earlier in the discussion (as part of Move 1), but nonetheless somewhat implies Move 2(iv) by referring to the future of this type of project and therefore succeeds in broadening the scope of the end of the paper.
Note how none of these papers use all of the available moves or use them in the same order! The most important thing is to use the moves that make the most sense for your project and what you are trying to accomplish.
[bg_faq_end] [bg_faq_end] |
[bg_faq_end]
[bg_faq_end]
[bg_faq_start]
Poster
Most of the move structures in the sections of a poster follow the same outline as for a journal article, except that the moves themselves must be accomplished more briefly.
[bg_faq_start]
Introduction
The main goal of the introduction to your poster is to convince your audience that your research is important (and therefore that the rest of your poster is worth looking at).
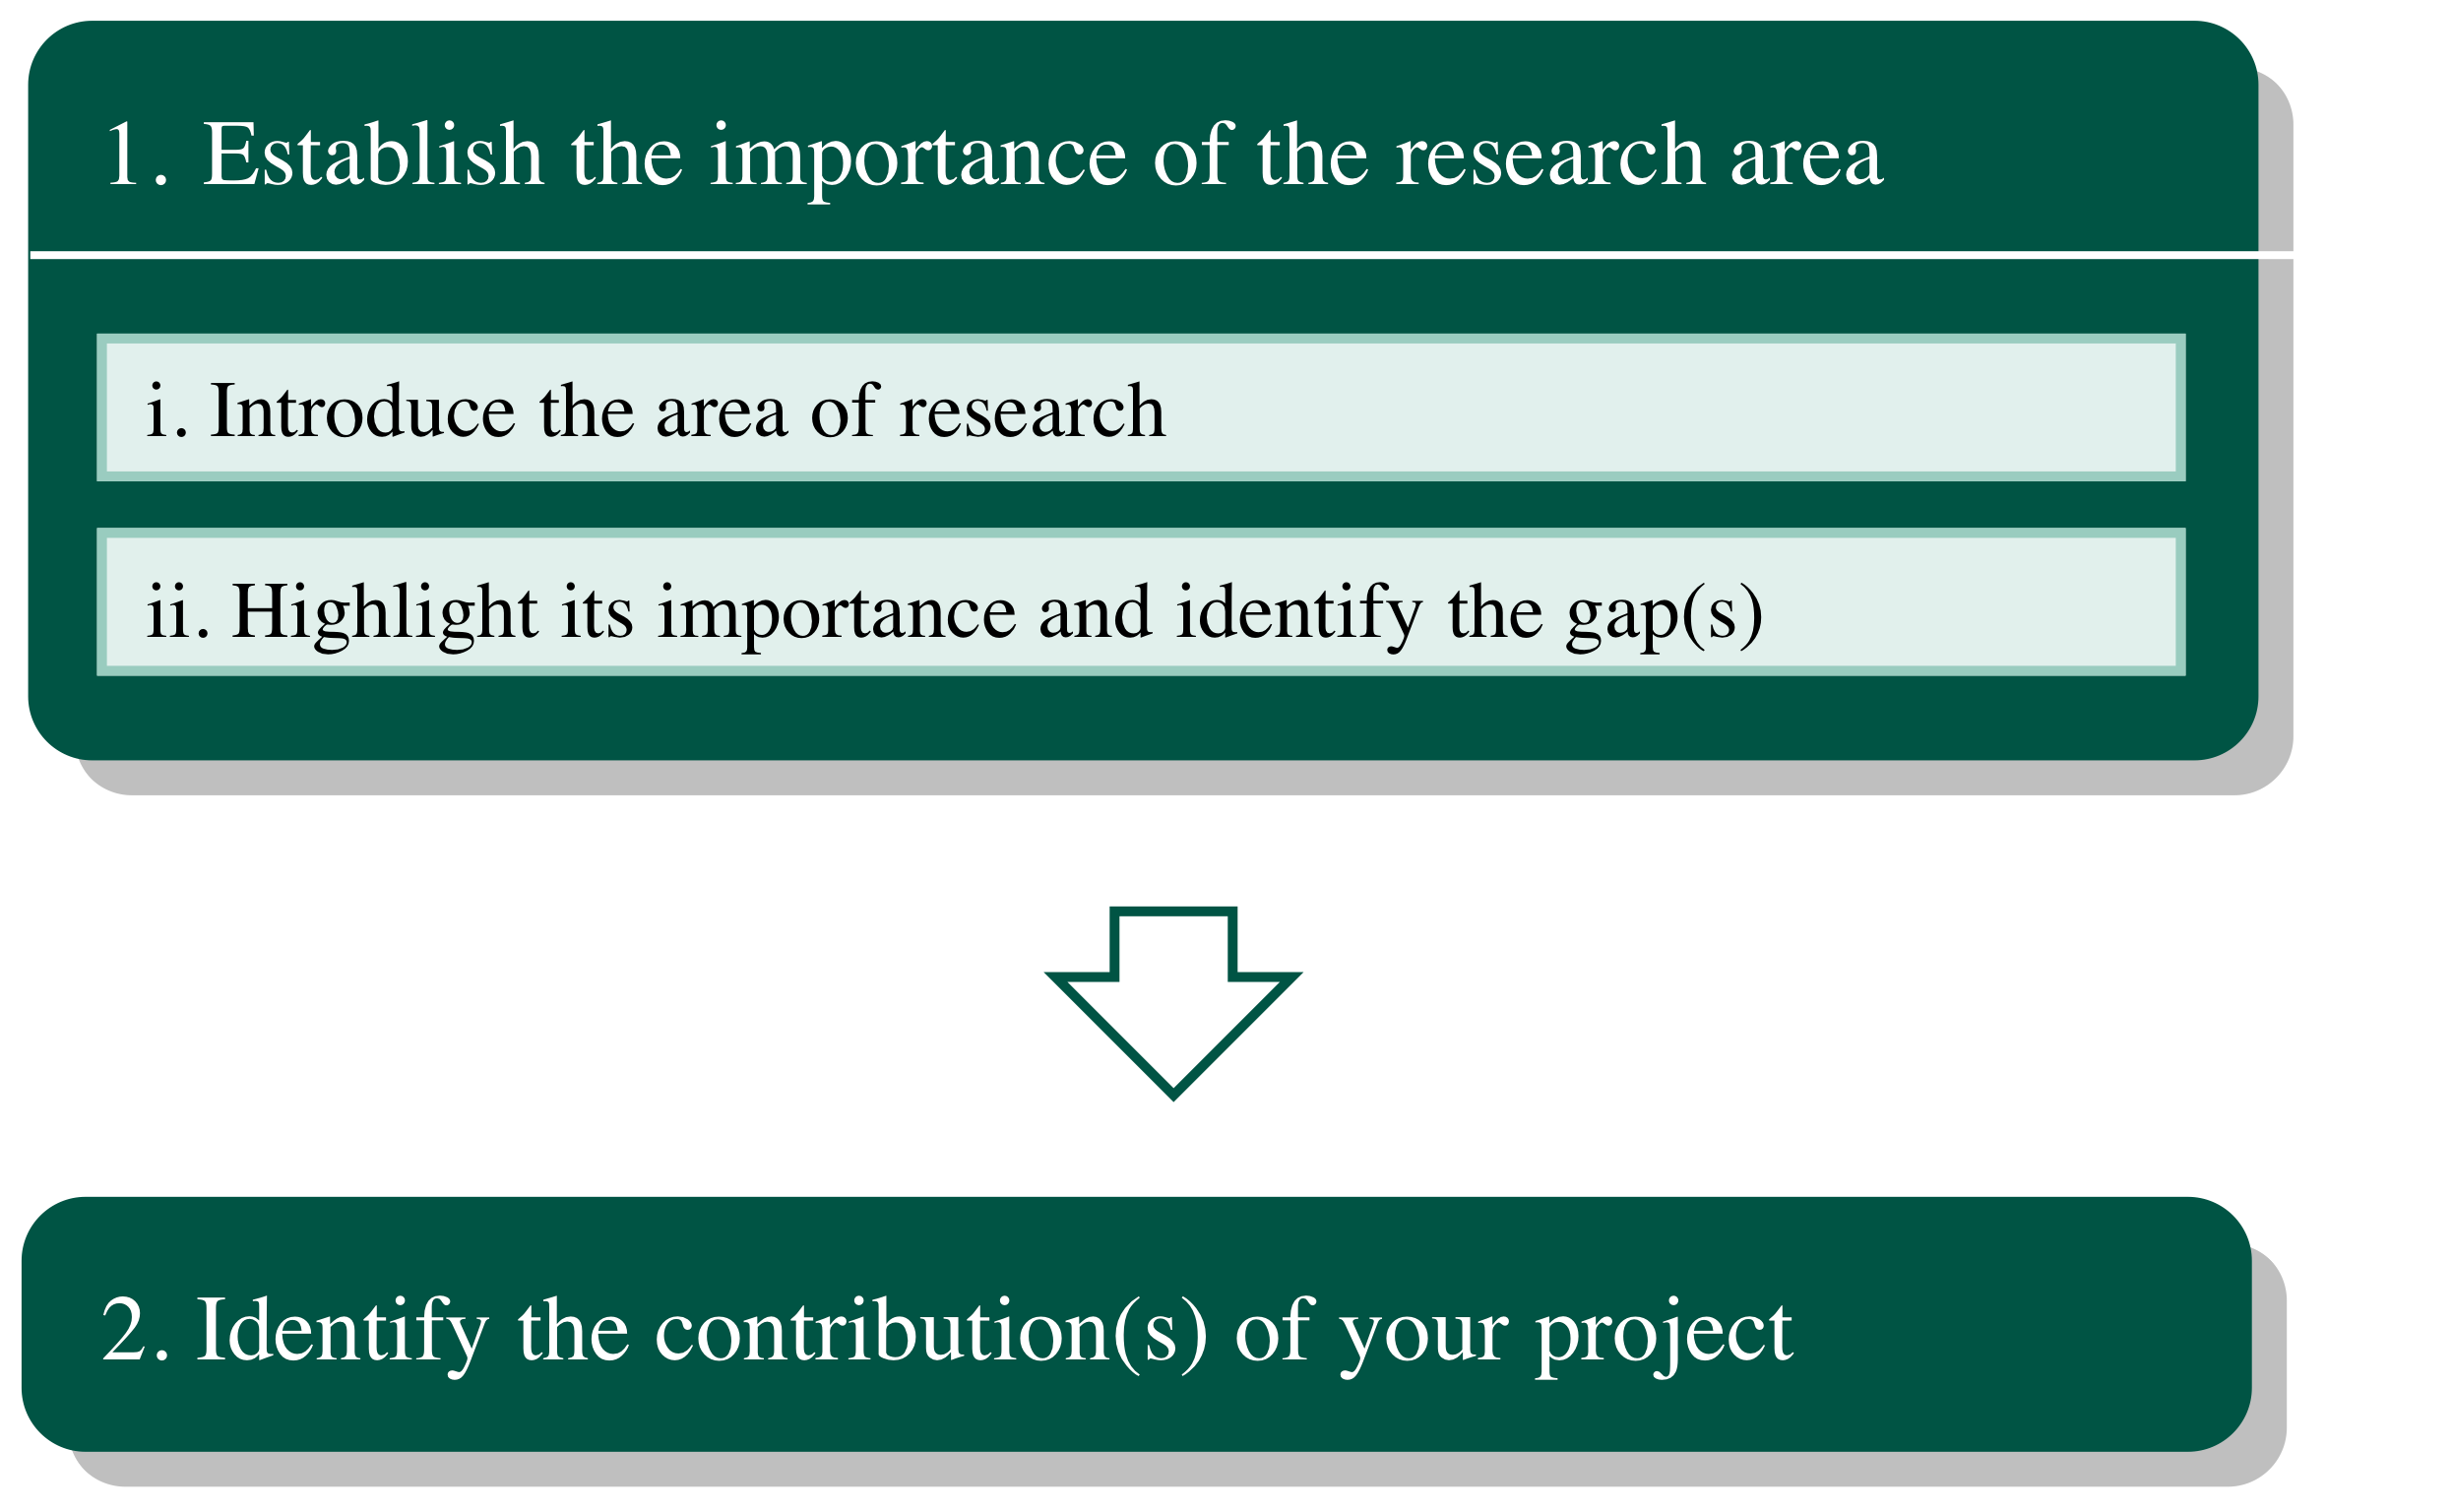
1. Establish the importance of the research area. Remember that in addition to being informational, the first move you make in your poster must hook your audience enough to convince them to continue reading your poster. So the more “punch” you can pack into a single concise sentence, the more effective your intro will be. Unlike in a journal article, Move 1 need not include a detailed review of the relevant literature; instead, 1 or 2 papers that directly show why your project is important is sufficient. If you don’t think it greatly highlights the importance of your project, you might choose not to cite the literature at all. However, identifying the gap in the literature is still a powerful way to both show the importance of your project and prepare your audience for Move 2.
2. Identify the contributions of your project. In this move, you should preview for your audience what you accomplished in your project. This can be given a separate sub-heading from the rest of your intro, such as “Project Goals.”
Here we provide an example comparison of introduction sections in a paper and in a poster based on Zhang, Dawes, and Walker (2001).
| Journal article Introduction | Poster Introduction |
|
The massive land use change in Australia associated with agricultural development has caused an imbalance in catchment hydrological regime, leading to increased land and water salinization over large areas. It is estimated that each year the total cost of salinization to the nation is about $270 million including cost of lost production, damaged infrastructure, and degraded environmental assets (Ref. 1). By 2020, the plantation area in Australia will increase to over 3 million ha and will have significant impacts on catchment water yield and salinity. The impacts of such plantations on the trade-offs between economic viability, environmental sustainability, and water resource security will depend on the spatial distribution of the plantations. It is important to be able to predict the water balance-vegetation relationships at regional scales to determine these trade-offs. For the relationships to be useful, the must be dependent only on data that is generally available at those scales. The research on the hydrological role of vegetation has extended over several decades (Refs. 2-7). “Paired-catchment” experimental techniques have shown that a reduction in forest cover increases water yield by decreasing evapotranspiration. “Single-catchment water balance studies represent catchments with diverse climate, vegetation, and soil, providing useful information about the hydrological role of vegetation in catchment water balance. On the basis of these studies a few empirical relationships have been developed linking evapotranspiration to vegetation types for specific sites (Ref. 2 and 7). The applicability of these empirical equations to other catchments needs to be evaluated. Although multiple numerical models have been proposed to date, their applications are limited in scope and practicality. The purpose of this paper is to quantify the long-term impact of vegetation changes on mean annual evapotranspiration at catchment scales based on data and parameters that are easily measurable at a regional scale. This study uses a “top-down” approach that links the catchment response to our understanding of processes at finer scales. By reviewing and collating many water balance studies from around the world, we seek to develop generic relationships for assessing the impact of vegetation changes on evapotranspiration. |
Massive Australian agricultural development has caused increased land and water salinizaiton, resulting in a national cost of about $270 million in lost production, damaged infrastructure, and degraded environmental assets (Ref. 1). The impacts of future plantation expansion and the trade-offs between economic viability, sustainability, and water security can be determined through regional water balance-vegetation relationships. Many relationship models developed to date are reasonably accurate but are limited in scope and practicality. Research Objectives
|
[bg_faq_end]
[bg_faq_start]
Methods
Unlike in a journal article, in which the methods must be detailed enough so that your project is replicable, a poster methods section is there only to provide your audience with a snapshot of how your results were obtained so that they can better understand your results and your project as a whole. It is perfectly appropriate to use bulleted lists and incomplete (yet still clear) sentences in your poster Methods section.
1. Identify important materials. This move should provide your reader with only the most essential information about the materials you used in your project, such as your major reactants or samples or your basic experimental design.
Below we provide a few ideas of what may or may not be appropriate to include on a poster to accomplish Move 1. This chart is not exhaustive and will apply differently to different types of projects and symposiums.
| Likely appropriate to omit from your poster “Materials” |
Likely appropriate to keep |
|
|
2. Summarize important methods. Only the most essential parts of your methods should be described on your poster. If you were to tell someone in less than 30 seconds how you conducted your project, what would you say? Don’t forget that you should still include relevant quantitative values, because numbers can actually be a very concise way of communicating information.
Here are some examples of how a plethora of information in a journal article might be condensed for a poster Methods section:
| In a journal article Methods section | Source* |
In a poster Methods section |
|
The vertical reflection profile was collected at a 0.10 m vertical step size from surface to the bottom of the borehole. All GPR data were recorded using a manual trigger mode and measuring tapes with manufacturer-recommended settings for temporal sampling interval and minimum antenna separation. A trace stack of 64 was used for all surveys.
|
Steelman, Kennedy, and Parker (2015) | VRP parameters: Verticle step size = 10 m; trace stack = 64 |
|
A schematic diagram of the experimental setup is shown in Fig. 1. The time projection chamber (TPC) with a volume of 13 m3 is mounted inside a magnet 5.5 m in diameter with a magnetic field strength of 0.525 kG and a heterogeneity of <2%. The source of 2β decay is 136Xe, placed in the central part of the detector. The latter is separated from the other two volumes, which are filled with СН4, by Mylar films 50 μm thick. The detector operates at atmospheric pressure and has two drift gaps, so that the high-voltage electrodes are attached to the upper and lower planes of the detector.
|
Belov et al. (2012) | [The schematic alone] |
|
The pH of the sample was adjusted by adding concentrated HNO3 and measured with a digital pH meter (Model-DP 215M, Dongwoo, Medical System, Korea). All standard stock solutions (1000 ppm) were obtained from Kanto Chemical Co. Inc., Japan. A known amount of standard solution was used to prepare a series of concentrations of working solutions. Deionized water obtained from an Elgastat (Model UHQOS, England) purifier was used for this analysis.
|
Mottaleb, Woo, and Kim (2001) |
|
|
Each egg mass was gently divided into six similar weight portions (91 g), placed into mesh baskets held in individual compartments of a single trough and acclimatized for 1 h. Following the acclimatization period, treatments were applied to each compartment by pouring the contents of the respective aliquot into the water column. Treatments were administered each day at ~0830 and ~1530 until embryos developed eyes. Eggs were exposed to an untreated control and 2.5, 5, 10, 15 and 20 mg L-1 PAA in each trough (N = 4); PAA treatments were applied nominally from the stock solution, which was confirmed to be 35 g L-1 PAA using a Peracetic Acid Vacu-vials Kit (CHEMetrics). Individual treatment concentrations were verified as above 45 s (chosen in preliminary assays) after treatments were applied.
|
Straus et al. (2012) |
|
* The journal article Methods excerpts are adapted from these articles; the poster Methods were created based on the information in these articles.
[bg_faq_end]
[bg_faq_start]
Results
In order to engage readers and help them understand complex results in a short amount of time, your results should be presented as well-constructed figures (or tables) with descriptive captions alone. If done well, a figure should be sufficient for viewers to fully understand a set of results. To learn how to do this, be sure to check out our page on using visuals.
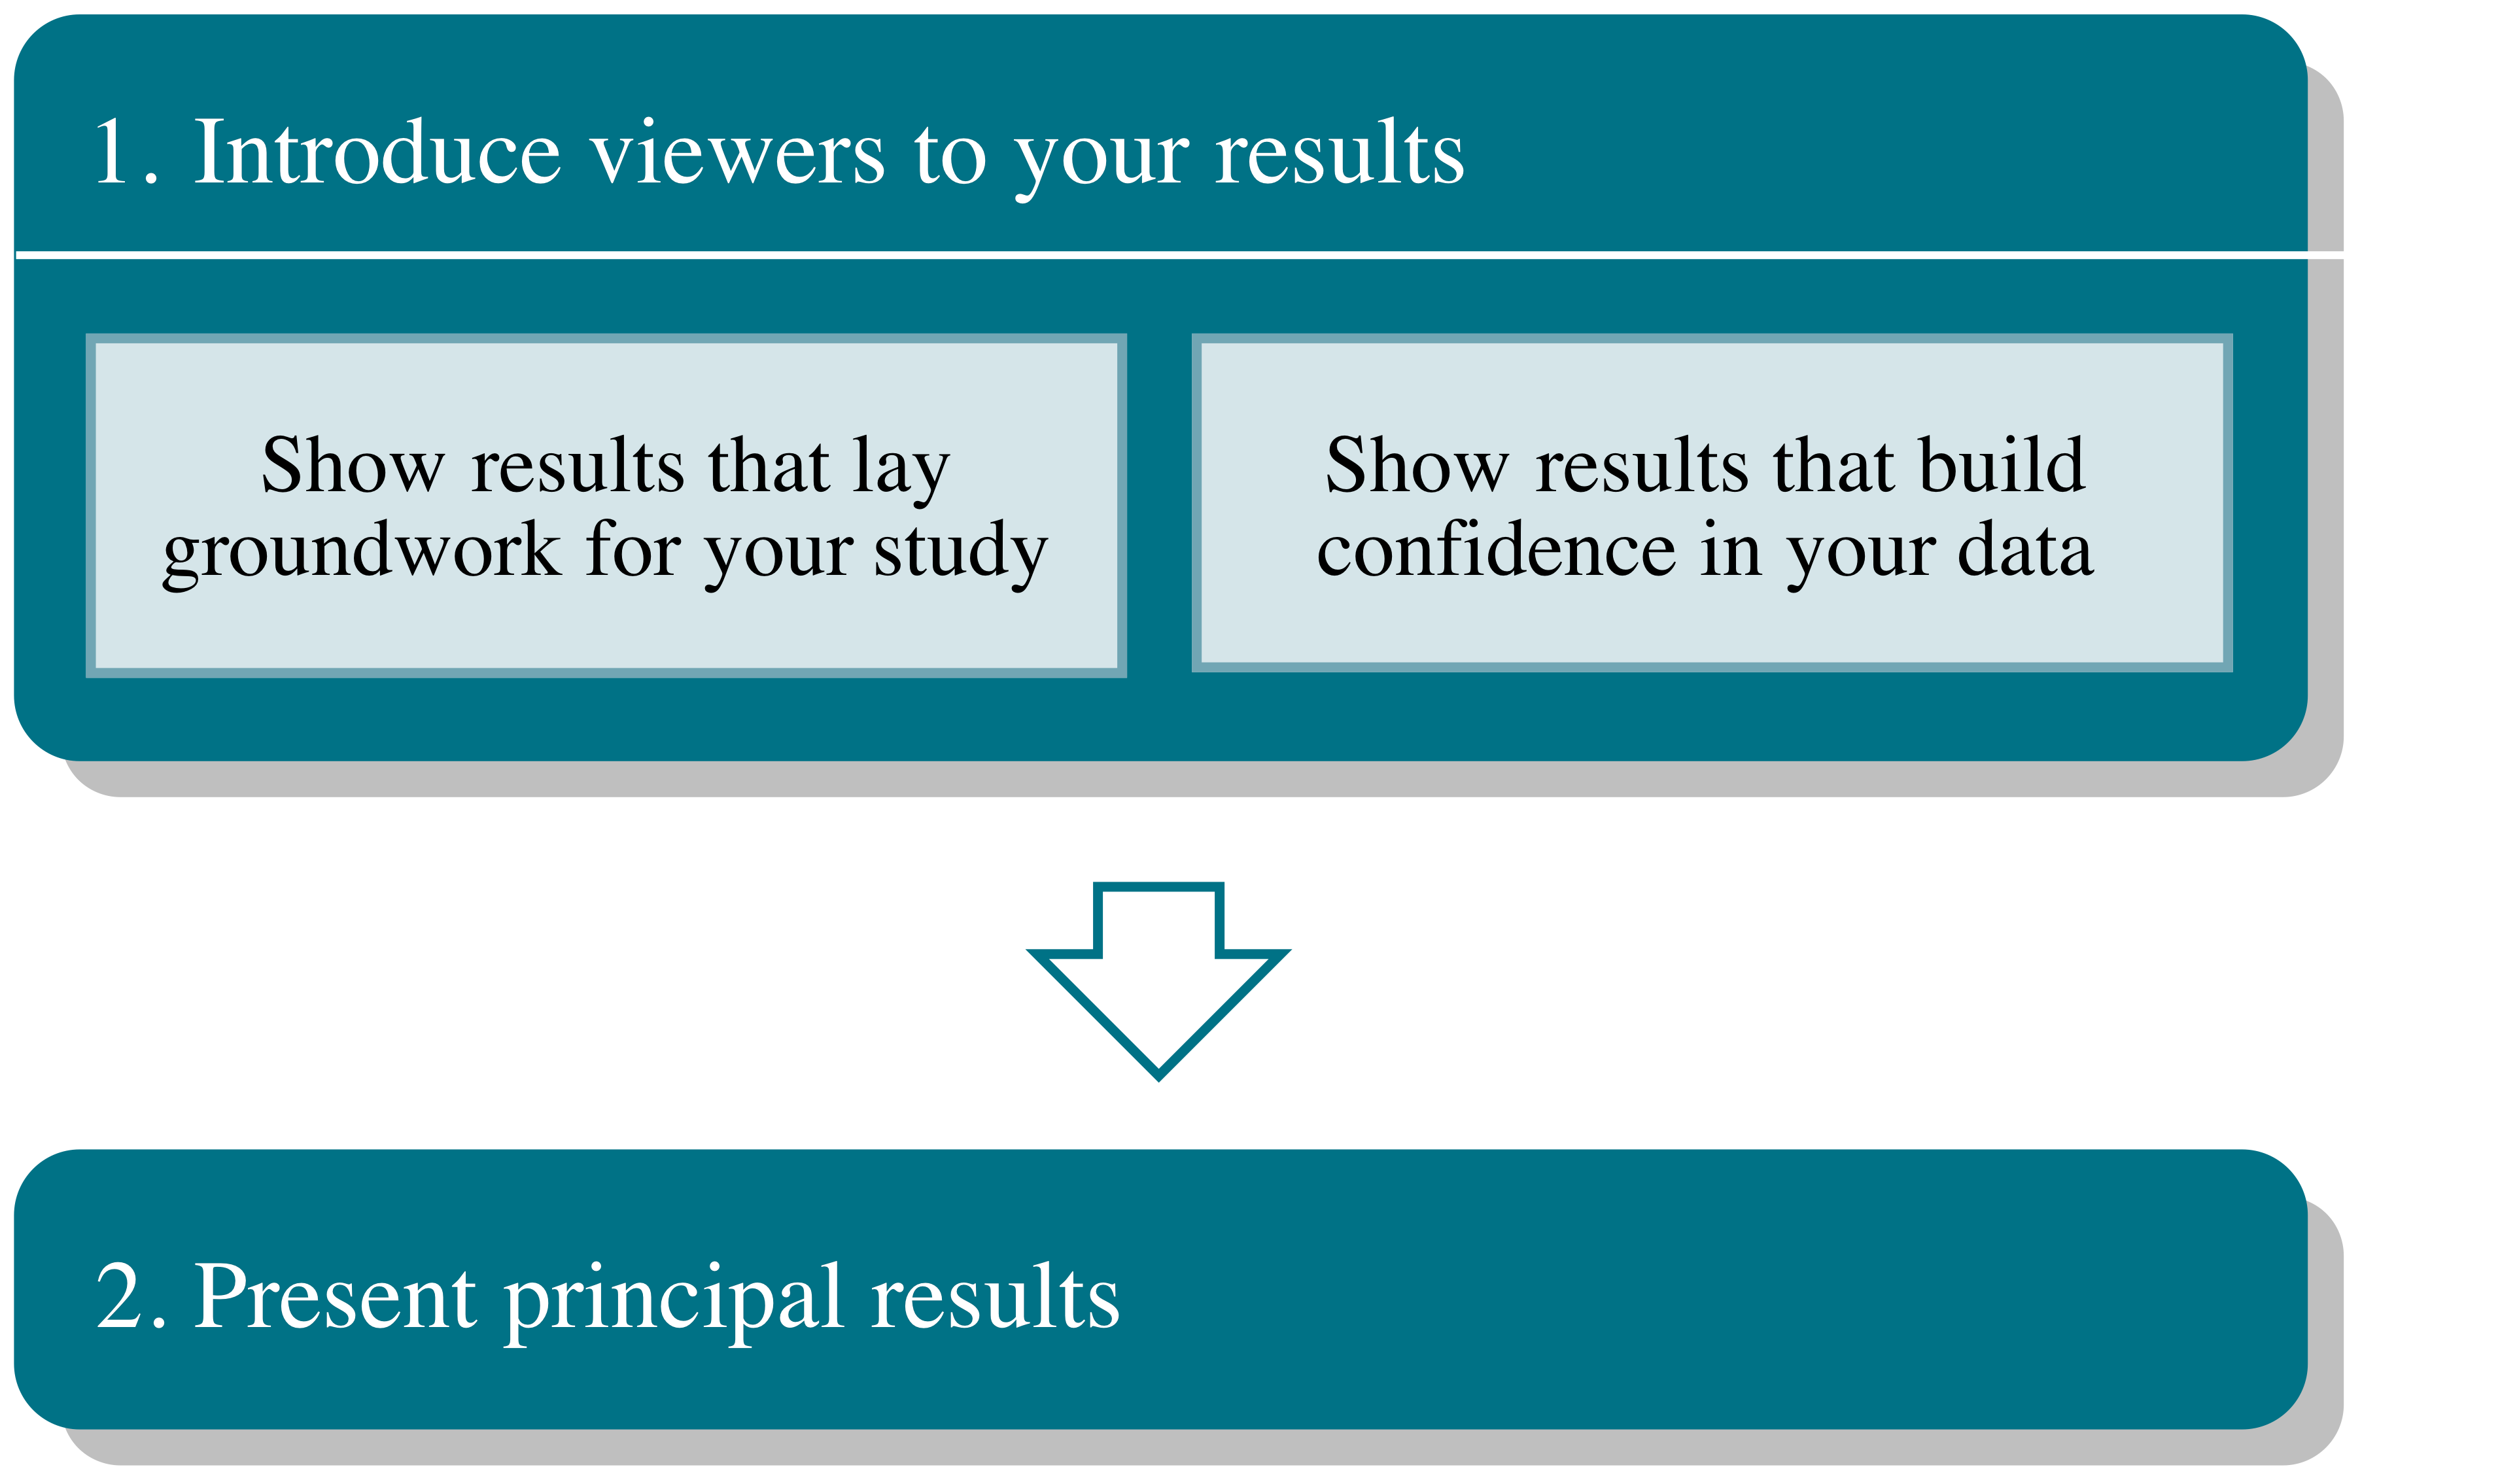
1. Introduce viewers to your results. Like in a journal article, your results section here should tell a story of scientific discovery. If you were telling your friend a story, would you jump right into the story’s climax? It would make a better story if you led up to it with a few points that would make the most important part of the story make more sense or be more exciting to hear. In your results section, this fan be accomplished in multiple ways. One option is to show viewers a result that motivated your study, such as a key result from a previous students’ work. You can also choose to share a preliminary result from your own study that shows why you can be more confident in your principal findings or one that led you to these results through the investigative process. Whichever way you choose, be sure not to include more than one or two introductory figures so that Move 1 doesn’t dominate Move 2.
2. Present principal results. In this move, you should plan to include your most key findings and important trends in your data. Perhaps even more so than in a journal article, be sure to keep your figures as simple as possible; helpfully, color is perfectly acceptable (and actually encouraged!) in poster figures, which can help you make your figures quick to interpret. Figures are preferred over tables in this section because it is usually easier to understand the overall message of them at a glance.
You can followed your principle findings with an optional Move 3, Show supporting results, which includes key results that extend or strengthen Move 2. Include Move 3 if you think you have non-critical data that will strengthen your principle findings and are important for your reader to know. But remember that superfluous information can be confusing, so don’t use Move 3 without double checking that you have a good reason to.
[bg_faq_end]
[bg_faq_start]
Discussion
The Discussion is the sub-section of a poster that perhaps looks most different from that of a journal article. This is largely due to the fact that the goal of a poster is to present often very new results, which is mostly accomplished in the Results rather than the Discussion section. Thus, a poster’s discussion section is primarily used to sum up the main ideas of the work. For this reason, too, combined Results and Discussion sections are very common in posters.
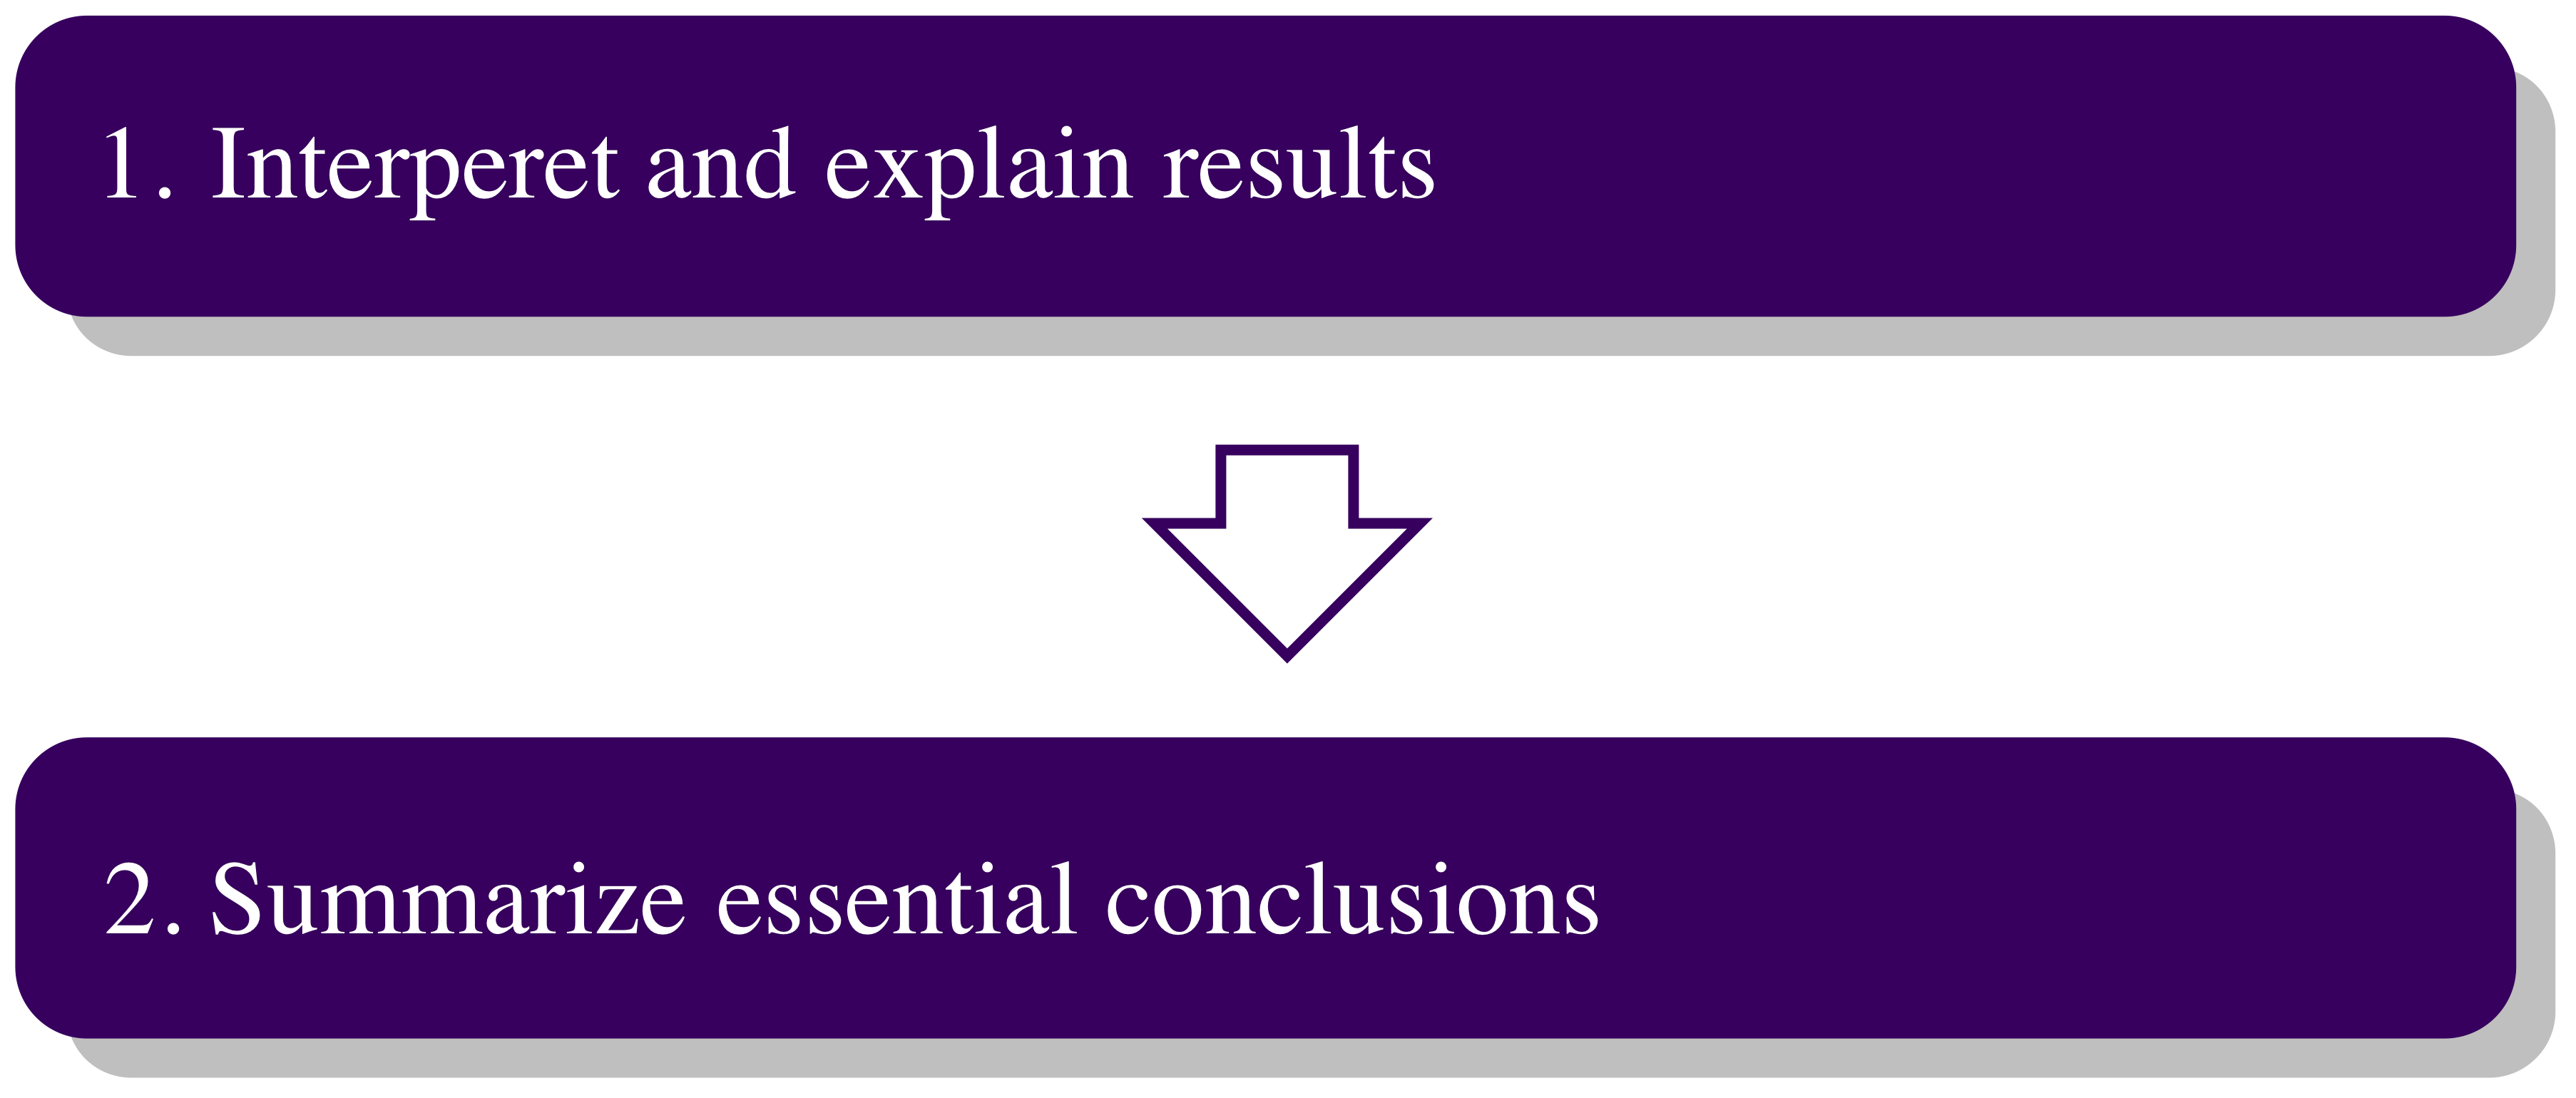
1. Interpret and explain results. Move 1 allows you to highlight and explain key findings you presented in your Results. Considering the brevity of a poster Discussion section, this should be done using minimal literature references. The idea is for your audience to be able to better understand your Results, not for you to fully validate possible explanations.
An example of a poster Discussion section might look something like the following, adapted from Sato et al. (2013):
2. Summarize essential conclusions. This move acts like a “take-home” message for your viewers. What do you want them to remember about your project and what you accomplished? Move 2 is often separated from the rest of the Discussion with a subheading such as “Conclusions.” You may wish to also include a “Future Work” section or subheading, especially if you are presenting to a group of fellow students who might be interested in continuing work on your project.
| Examples of Move 2 |
| Adapted from O’Brien et al. (2015): We show that the nonlinear oscillator model does not apply in general to nonlinear metamaterials. Instead, it is possible to predict the relative nonlinear susceptibility of large classes of metamaterials using a more comprehensive nonlinear scattering theory. We demonstrated the validity of nonlinear scattering theory and thus the importance of the mode overlap between the nonlinear polarization and its harmonic modes for efficient nonlinear light emission.
Adapted from Najafi, Zwiers, and Gillett (2015): Our multi-model approach identified a 1.2 ˚C net warming effect, which includes 1.3 – 2.2 ˚C greenhouse-gas induced warming offsets by aerosol-induced cooling. Considering predictions of increased greenhouse gas emissions as well as reduced aerosol emissions, our results confirm the need for significant reductions in greenhouse gas emissions in order to avoid a nearly 8.3 ˚C increase in Arctic temperatures by the end of the century.
|
[bg_faq_end]
[bg_faq_end]
[bg_faq_start]
Research proposal
Here, we will cover a standard format for constructing the Project Description portion of a research proposal. Throughout this section, keep in mind that each and every funding agency will have its own specific instructions for how it wants your proposal to be organized. You should always follow these instructions exactly, although you’ll likely find that sections that may be called by different names than we call them here, they include much of the same content and can be organized similarly.
[bg_faq_start]
Goals and Importance
The first section of the Project Description is intended to introduce the work by establishing its goals and its importance in the context of other scientific research. A clearly laid out argument is critical in this section for convincing a funding agency that it is worth their time to look at the details of the project itself.
| Potential headings for Section 1 |
|
|
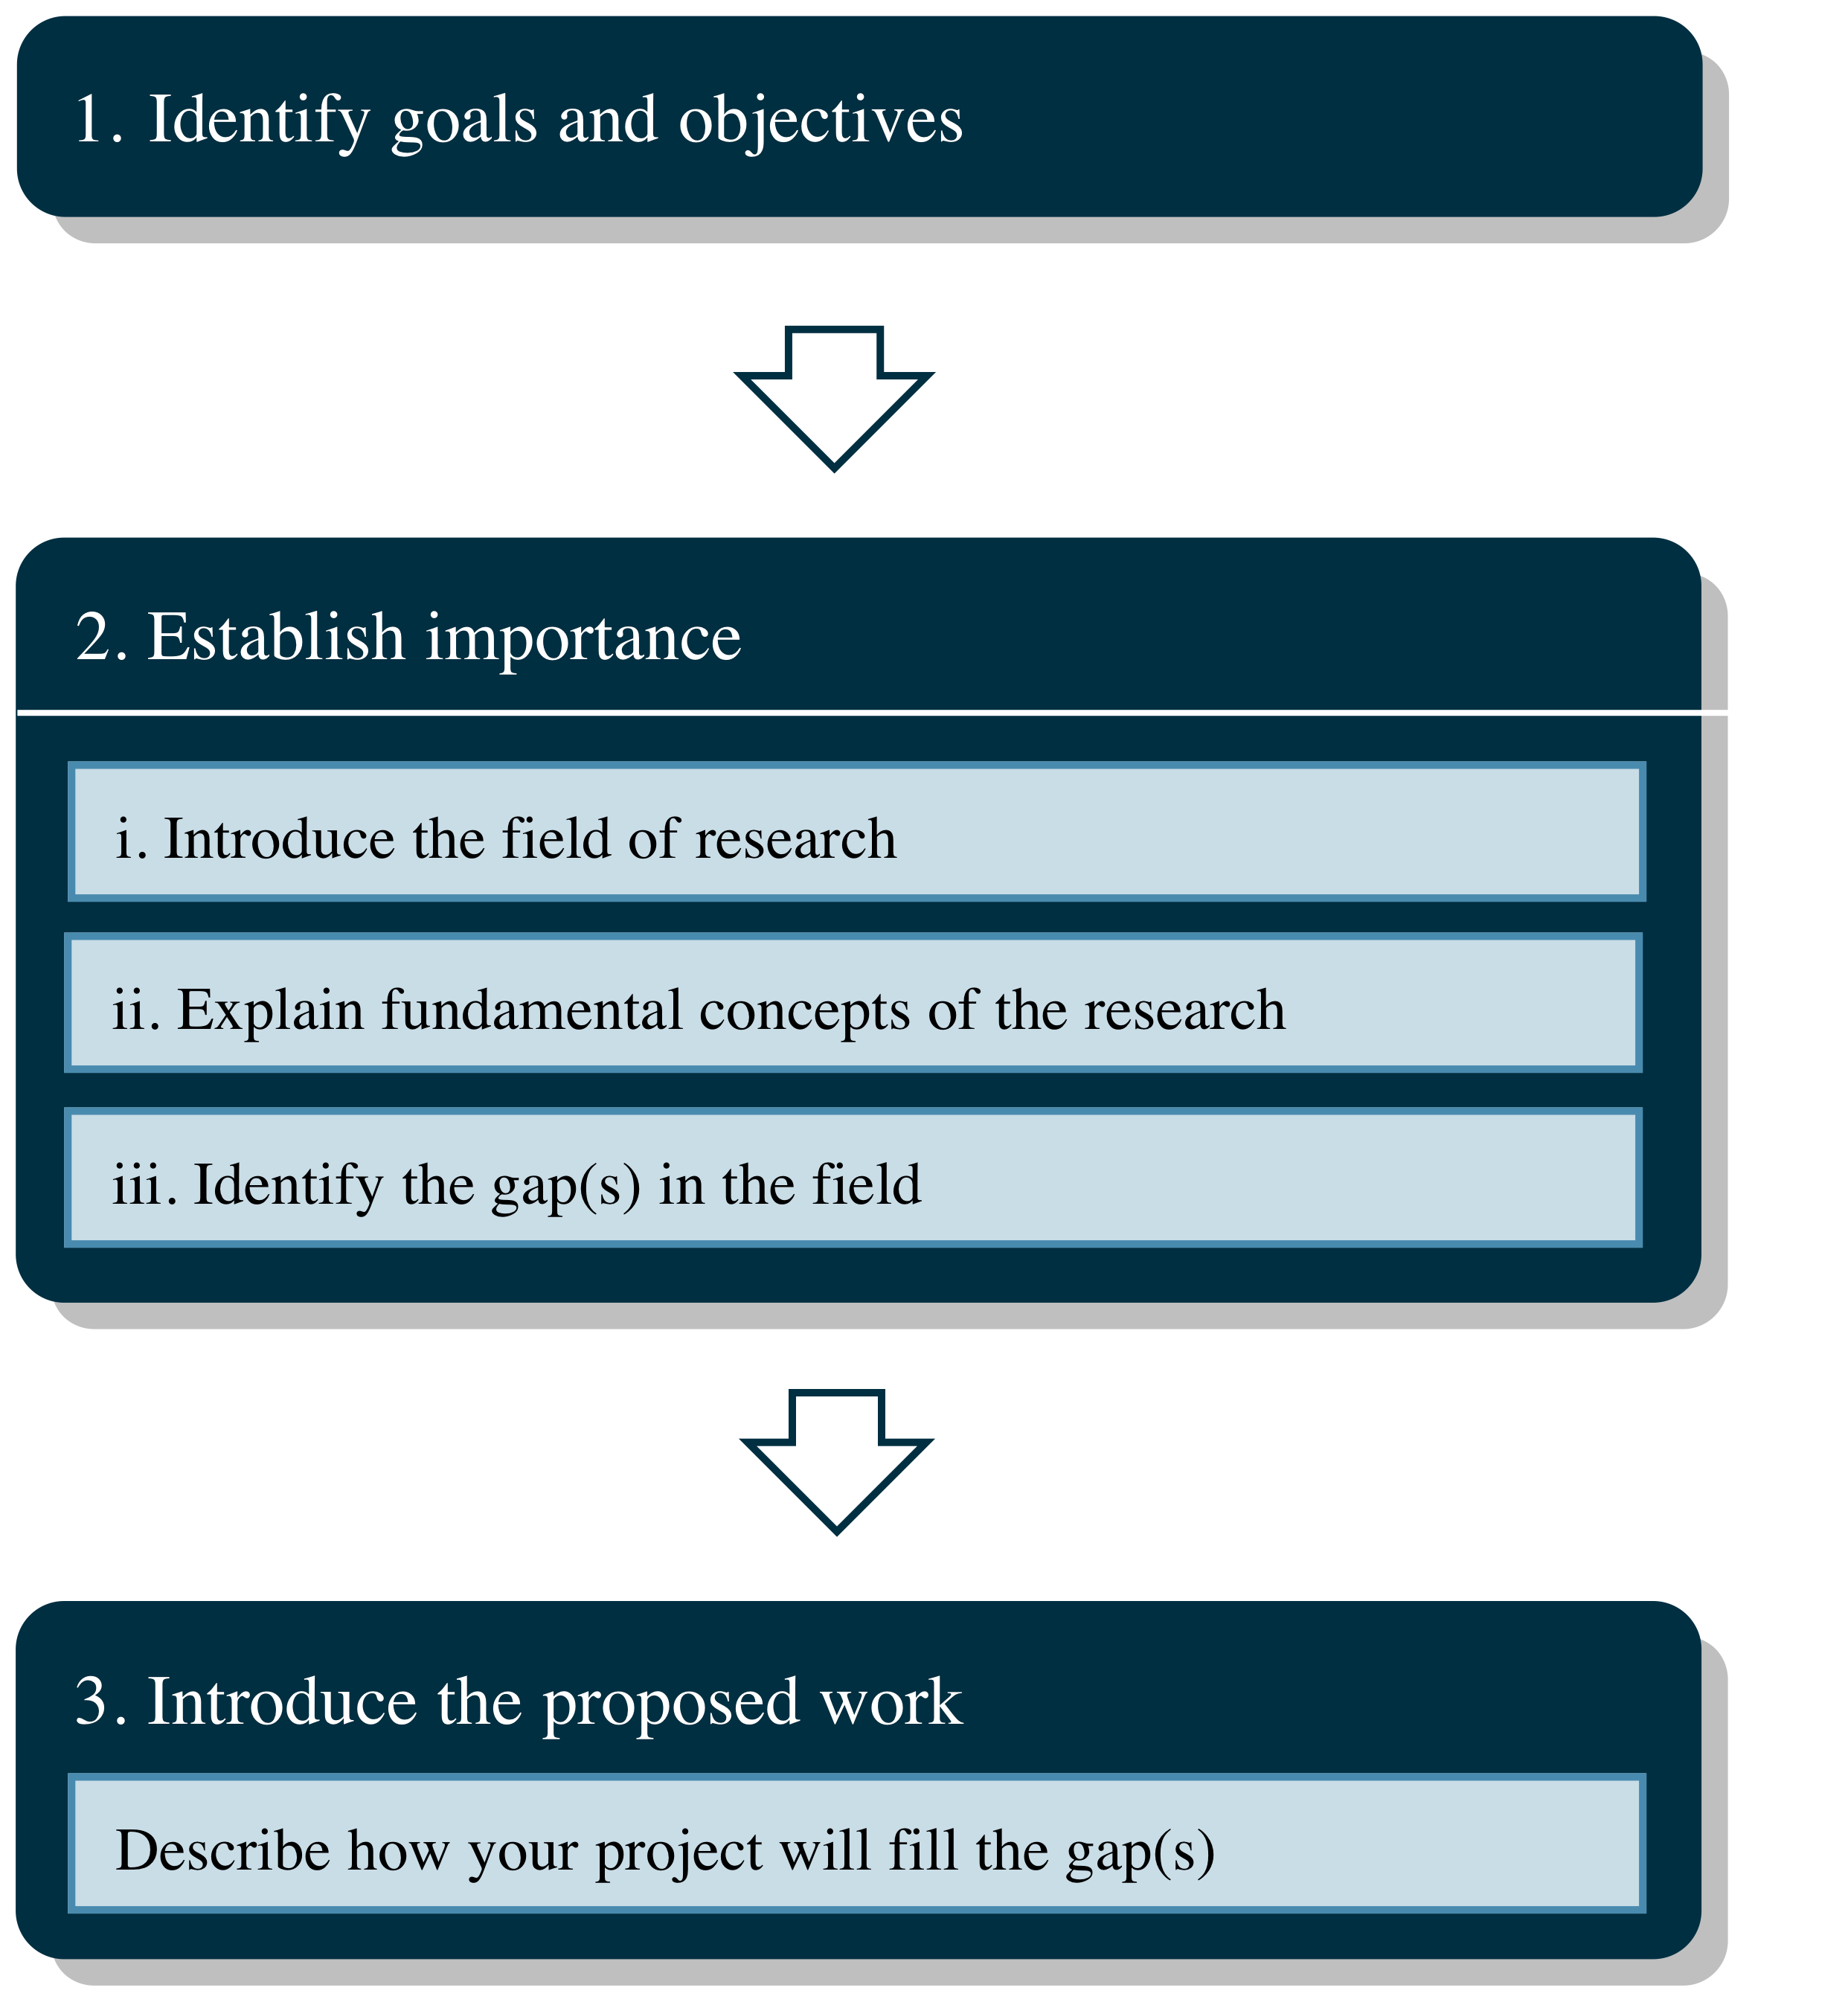
1. Identify goals and objectives. Although this section might have a narrower focus than Moves 2 and 3, it is usually important that it come first so that a funding agency can quickly determine whether or not the project will contribute to the agency’s own goals and therefore merits further review. The goals of your study are usually broad, long-term ends toward which your project is directed but will not achieve on its own; objectives are more specific and should be directly measurable in your research. Move 1 should establish both of these aspects of your study.
| Potential headings for Move 1 |
|
|
|
2. Establish importance. Proving to your audience that your project is important is crucial to obtaining funding. Each submove contributes to establishing the importance of the research you are proposing. First, you should introduce the general topic of your project in a way that hints at its importance. For example:
Although premature birth is the leading cause of neonatal death, its contributing factors are poorly understood.
In submove (ii), the scientific literature should be used to provide background information and important details about the topic. Who else has interest in this area of research? What have they discovered that is of great importance? Who benefits or will benefit from the research? What have others stated a need for? This should set you up to identify the gap in the literature (which you intend to fill with the results your project).
| Potential headings for Move 2 |
||
|
|
|
3. Introduce the proposed work. Once you have established that there is a great need for a greater understanding of some kind in the general scientific topic you identified in Move 2, you can present your project, which will save the day! If Move 2 identified a challenge, explain how your project faces the challenge. If it identified a problem, your project will solve the problem. This solidifies the importance of your project while identifying what it will actually do. Move 3 is not often given a separate heading of the kind in Moves 1 and 2, but instead flows more smoothly from Move 2 in a new paragraph.
[bg_faq_end]
[bg_faq_start]
Experimental Approach
This section is the most technical of the three in the Project Description and therefore must proceed in a logical manner that is easy to follow. By starting with what you’ve already accomplished in relation to the proposed project and showing that it is already yielding favorable results, you contextualize and strengthen the reader’s confidence in your proposed methodology.
| Potential headings for Section 2 |
|
|
|

1. Describe previous accomplishments. If you have done any previous research that worked towards the same or a similar goal, this is your opportunity to share its accomplishments. Doing so will build readers’ confidence in your research abilities and current project plan.
| Potential headings for Move 1 |
|
|
2. Identify promising results. Most funding agencies will hope that you have some empirical reason to believe that your proposed project will work, meaning that you have conducted preliminary research that has indicated that your objectives are reasonable and achievable. In this move, you should share these results (if you have them).
| Potential headings for Move 2 |
|
|
3. Propose methodology for reaching an objective. This move should be distinctly made for each objective that you presented in your Goals and Importance section in the same order as you presented them. It is customary to first present simpler, more straight-forward experiments first and progress to those of higher risk or, alternatively, to group methodologies by the types of information that will be gathered, such as synthesis yields versus biproduct identifications. Start by transitioning from your preliminary work to your proposed work in submove (i) before getting into the exact methodology.
| Potential headings for Move 3 |
|||||
|
It is helpful to use a separate sub-heading for each iteration of Move 3, as well, so that each objective’s methodology is clearly distinguished from the next. These headings can be generic, such as “Objective 1,” or descriptive, such as “TENR Library Construction.”
Unlike in a journal article methods section, only provide enough detail in this section to convince your audience that you can do the work. Focus on the general approach and avoid details (e.g. instrument model numbers or reagent purities) that will take up space and distract your reader from the overall importance of your project.
In submove (iii), address potential limitations or setbacks you can forsee in your plan. You are bound to have some in any research, and acknowledging them shows that you have thought carefully about your proposed research.
[bg_faq_end]
[bg_faq_start]
Outcomes and Impacts
The first two moves of this section essentially summarize what you have already presented in a new format. The end of the proposal then broadens in scope to focus on the wider impacts of the research, beyond its addressing of your individual objectives to the more general goals of the scientific area.
| Potential headings for Section 3 |
|
|
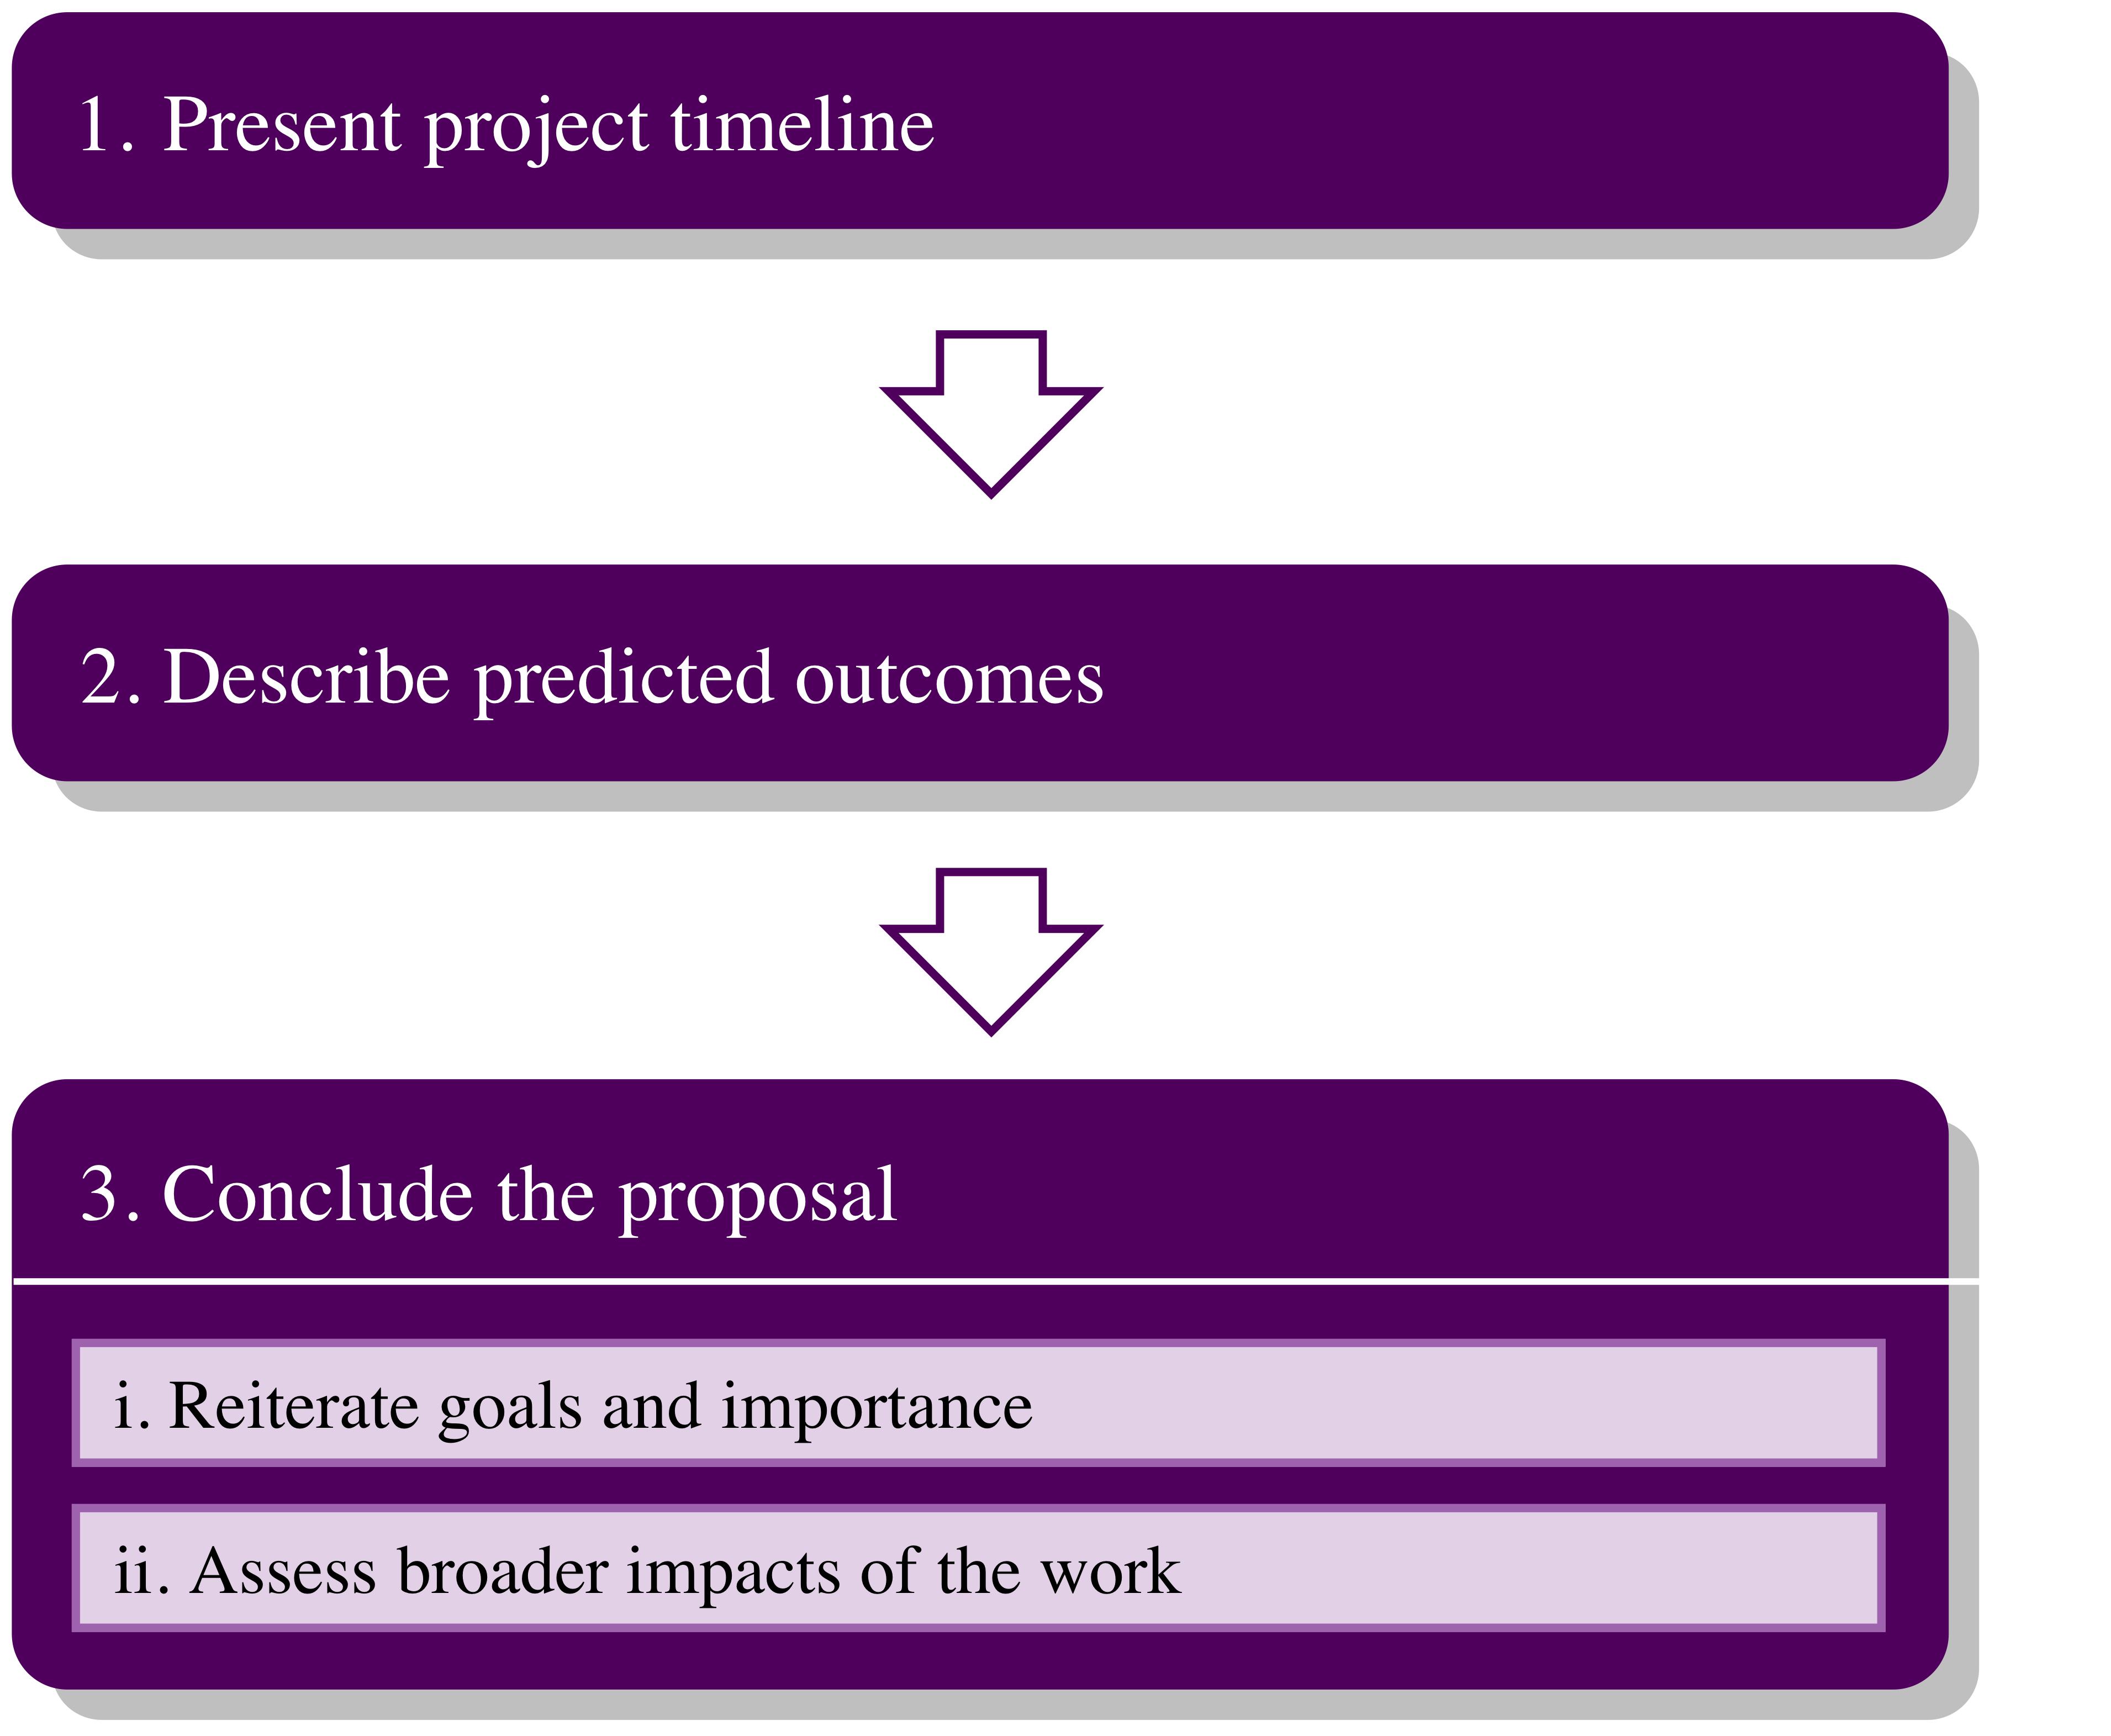
1. Present project timeline. This move allows you to summarize your experimental section in away that makes your anticipated accomplishments tangible. The timeline is presented in paragraph form but reads very list-like, with phrases like “In the spring of 2016, we will complete the Si experiments.” The timeline can be fairly general but must be realistic.
| Potential headings for Move 1 |
|
|
|
2. Describe predicted outcomes. List measurable achievements that link back to your objectives in section 1. Be as specific as possible so that readers are left with the feeling that your project will result in tangible outcomes.
| Potential headings for Move 2 |
|
|
|
3. Conclude the proposal. Because they are key components of the proposal, Move 3 begins by summarizing once again the goals and significance of the proposal. This can usually be accomplished in roughly 3 sentences and comprises its own paragraph. Make your closing remarks in submove (ii), where you tell your funding agency how your project will benefit the greater scientific community and/or general public. The broader the impact of your project and the more people it benefits, the more likely it is to be funded.
| Potential headings for Move 3 |
|
|
|
[bg_faq_end]
[bg_faq_end]
[bg_faq_end]