[bg_faq_start]
Broadly organizing a paper
The broad structure of a paper in geological fields don’t follow a rigid IMRD as often as papers in other disciplines. For example, a geology paper will often include an entire section dedicated to describing the study area, whereas this might only be one component of the Methods section in other papers.
For most journals in geology, papers should still always begin with an introduction and end with general conclusions, with other narrower, more technical information falling in between. It is this middle portion of a geology paper that might look much more different than others. Why might this be? One contributing factor is that geologists can rarely set up very controlled “experiments” like we think of them in Chemistry or Physics. Instead, studies revolve around understanding Earth’s processes on a much greater timescale. So rather than a paragraph-by-paragraph alignment between methods of, results of, and conclusions about an experiment or experiments, geological papers will focus greatly on the study area, parameters, data sources, and other such details.
| Examples of broad organization in geological journals | ||
| Journal | Organizational headings | Adapted from… |
| Marine Geology |
1. Introduction
2. Geological and seismotectonic framework
3. Data and methods
3.1. Geophysical data
3.2. Chemical, biological and oceanographic data
4. Results
5. Discussions
6. Conclusions
|
(Loreto et al. 2013) |
| Geomorphology |
1. Introduction
2. Study area
3. Methods
3.1. Field methods
3.2. Statistical methods
4. Results
5. Discussion
6. Conclusion
|
Livers and Wohl (2015) |
| Journal of Geophysical Research: Solid Earth |
1. Introduction
2. Seismic Data and Data Processing
3. Joint Inversion at Different Times in the Coda
3.1. Field methods
3.2. Statistical methods
4. Inversion Results in the 1–3 s and 12–20 s
Period Bands 5. Conclusion
|
Obermann et al. (2014) |
As you’ve learned by now, different journals will have different expectations and requirements for the specific organization of your publication. But even with some of the unusual main headings for some of the sections in the papers listed above, you should observe how each starts and ends broadly, with more technical descriptions in the middle, following the same hourglass shape as in papers in any other scientific genre.
[bg_faq_end]
[bg_faq_start]
Describing sample locations
The precise location of each sample or data collection site is extremely important when writing a paper. The Geological Society of America recommends the following for providing sample locations:
- Use decimal degree format, with the associated projection information, whenever possible.
- Also provide graphical representation of each site on maps.
- If specific location information is sensitive, provide as much information as possible and explain the situation in a cover letter.
- If information is imprecise or unknown, such as archived samples in museums, provide the current location and any available information on the samples’ provenance.
Geographic coordinate systems
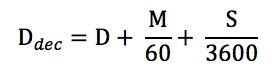
Decimal degrees and degrees, minutes, and seconds (DMS) are two ways to express geographic coordinates.
Decimal degrees: 28.7031°, -77.0331°
DMS: 28° 42′ 11″ N, 77° 01′ 59″ W
In most professional geological publications, decimal degrees are preferred. You can easily convert DMS into decimal degrees by the following simple formula:
Most often, you will use a topographic map or a GPS to determine the coordinate location of a study or sample. These tools use specific datums, or reference points, to determine a precise location. (Note that the word “datum” here is not a synonym for “data point.”) There are many, many datums across the world, but each will yield slightly different (or much different, depending on your location and selection) coordinates for a single spot when used to configure a GPS. It is important to take this into consideration whenever using or creating a topographic map.
[bg_faq_end]
[bg_faq_start]
Using geologic terms, abbreviations and symbols
Cartographic symbolization standards
The Federal Geographic Data Committee, as part of the U.S. Geological Survey, has written an extensive document detailing the use of symbols in geological maps. It’s purpose is to provide “a single national standard for the digital cartographic representation of geologic map features.” This 300-page document can be found here.
An exhaustive list of specific symbols can be found in the original document. However, for our purposes, we will just teach you a little bit about the reasoning behind the symbolization: specifically, how to note your confidence in a map feature and how to use color and pattern.
Scientific confidence
As with any kind of scientific communication, expressing your level of confidence is extremely important. Geologists can accomplish this in a map using a question mark on a symbol to indicate that the identity or existence of a feature is questionable. Furthermore, a frequently dashed line as opposed to a solid line can show that the precise location of the feature in the field or its position on the map is not completely certain.
| Cartographic representation of locational accuracy | |
| Symbol style | Use |
| Solid, continuous line |
The location of a feature is accurate
|
| Long-dashed line |
The location of a feature is approximate
|
| Short-dashed line |
The location of a feature is inferred
|
| Dotted line |
The location of a feature is concealed
|
Confidence can be additionally expressed using shaded regions around features to show a zone of confidence, as shown in the following diagram from the FGDC:
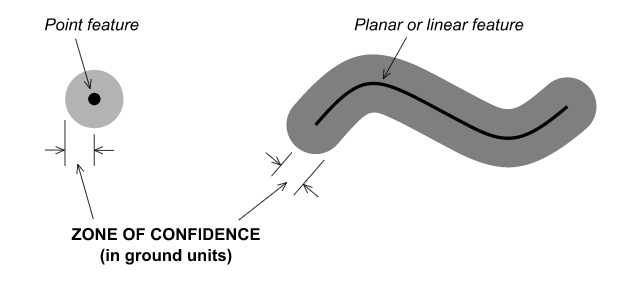
This zone indicates the likelihood that a feature actually occurs in the location it is shown. Note that the numerical values of these zones depends on such things as the the area’s geology and terrain and the quality of the base map. These factors will vary from area to area and from map to map, and since different organizations have different mapping needs, there is no universal standard for determining the size of this zone. Instead, it is up to each organization and geologist to set this value.
Symbol color and pattern
Color and pattern selection will depend primarily on the purpose of your map, the age and type of rock, and the size of map-unit areas. For example, on maps of rocks of mostly one age group, sedimentary rocks should be distinguished from volcanic rocks and plutonic rocks. On maps of mostly one type of rock, color can be used to differentiate between rock sequences.
| Some possible uses of color in different types of maps based on their purpose | ||
| Map | Color use | Example |
| Geophysical |
A graduated set of hues of similar value, like purple and magenta to orange and red
A rainbow of hues in which the values alternate between full color and lightly screened color
|
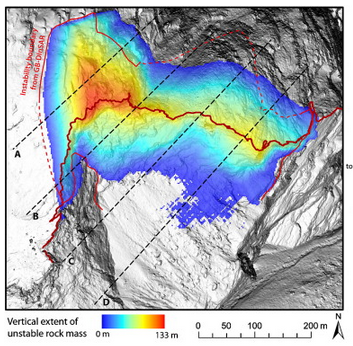 Adapted from Gischig et al. (2011) Adapted from Gischig et al. (2011) |
| Stability/hazard |
The brightest colors are used on areas of highest instability
The use of red to show areas of greatest hazard and green or yellow to show lower hazard
|
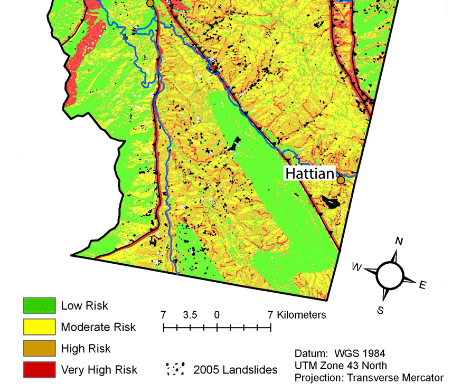 Adapted from Kamp et al. (2008) Adapted from Kamp et al. (2008) |
| Hydrologic |
A range from light blue at the shallowest depths to dark blue at the greatest depths
A range from dark blue where dissolved solids are at lowest concentrations to dark red where concentrations are highest
|
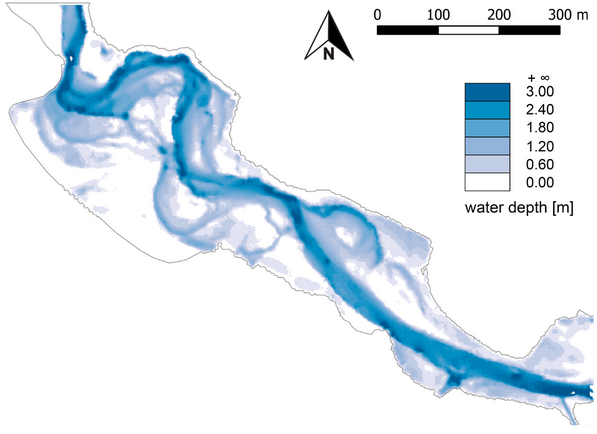 Adapted from Mandlburger et al. (2015) Adapted from Mandlburger et al. (2015) |
Color should always be specified using CYMK (cyan/yellow/magenta/black) ink. Other schemes, such as RGB or HSV will get automatically converted to CYMK upon printing, which will often give you unwanted color shifts. Other considerations are:
- Amount of color: Use CYMK values that total less than 100 when added together (i.e. 30% cyan, 20% magenta, 40% yellow: 30 + 20 + 40 = 90), especially in larger areas.
- Light yellow: Avoid using less than 9% yellow, because it will often be too light to distinguish from white.
- Contrast: To make two colors distinguishable, make sure to change one of the CYMK values by at least 20%, such as 40/3/10 (40% cyan, 3% yellow, 10% magenta) to 40/3/30.
Ideally, patterns should be used only when necessary for differentiation, because they can make a map look too busy and confusing.
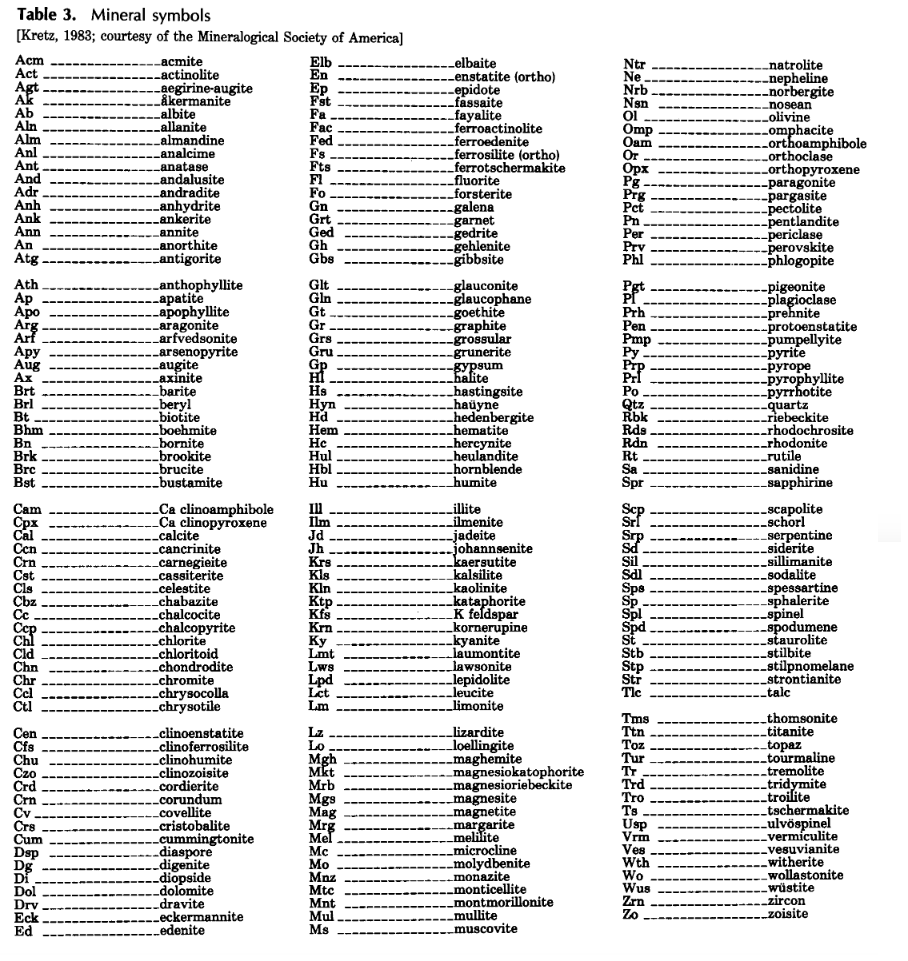
Abbreviations of mineral names
To aid conciseness when using certain mineral names repeatedly or in tables, it can be useful to use an abbreviated version of the name. Here we provide you with a table of standard abbreviations of common mineral names (from the United States Geological Survey “Suggestions to Authors”).
[bg_faq_end]