Irene Still Hanging Around

Like a guest that just won’t leave, the effects of Irene the Hurricane still seem to be around Middlebury. Primarily what we’re watching now is the Otter Creek.

South Street-flooding in the fields

It takes a while. All the headwaters that feed into the creek have been slowly dropping, like my own muddy Lemon Fair River, and so the Otter Creek is rising. How fast? The football team, at Middlebury for pre-season practice, skipped the weight lifting today and went to fill and stack sandbags at Jackson’s on the River (the old Tully and Marie’s to you alumni) ( The old Woodie’s to you older alumni). (Great little article here).

Another stream feeding the deluge is the North Branch River, the one that falls along Route 125, heading up to Breadloaf and the Snow Bowl. Last I heard, the road is still closed (picture here), although Breadloaf is still accessible by back roads.

Otter Creek Levels-via National Weather Service

As I write, the Otter Creek in Middlebury is at 6.9′, within the top 20 crests of all time, and is thought to reach peak tonight around midnight. Not wanting to wait that long, I took some pictures downtown to try and capture the feel of a simply amazing amount of water, brown and muddy, crashing through town. One of our seasonal landscapers was a dairy farmer in Orwell for 30+ years, and in his experience he’s never seen water so muddy. Another guy in our shop is at home, an island experience, surrounded by water on all sides unable to come to work.

On Battell Bridge Looking East
Jackson's on the River
The Falls
Looking under Battell Bridge
The Bottom of the Sluice


Irene visits Middlebury

Given all the flooding and destruction in the state, I feel very fortunate here at Middlebury, and at my house overlooking the Lemon Fair (flooded, but looks like a normal spring). While we certainly had some damage on campus, it feels relativly minor compared to friends in East Middlebury in need of a new backyard.

Irene brought 3.21″ of rain to the main campus weather station, to bring a wet August total to about 7 3/4″ of rain. The peak wind registered was 37 mph, at about 6:30 yesterday. Breadloaf campus saw 5.13″ of rain, bringing their August rain to 11.27″. They saw a peak wind gust of 39 mph, later in the evening than down in the valley.

No major problems occured on campus. Facilities was busy with their usual leaks here and there, but it didn’t seem any more significant than another big rain. We’d spent a chunk of Friday mobilizing for the storm; gassing and sharpening chain saws, getting wet vacs ready, checking pumps.

Monday morning dawned clear and fresh, and revealed a mid September amount of fallen leaves, along with a plethora of sticks. Some large branches broke in the wind, as well as having a couple of trees topple over. Overall, however, I was pleased with the relative lack of tree damage. This late in the year weak trees are already shedding their leaves, or have thinner than usual crowns, so the more storm prone trees have less “sail” to catch the wind. A large limb heavy with black walnuts fell behind Turner house, but other fruit bearing trees did fine.

The immense rain in a short amount of time causes the most damage for trees. The soil below the tree turns to soup, roots lose their holding capability, and trees can topple in the wind. A good example is a Basswood lost right below Gifford, at the base of the ledge. All the water percolates a little ways down the soil profile, until it hits the ledge, then drains downhill right towards this tree. Combine that with the lack of roots on the ledge side of the tree, and the reason this tree fell is pretty clear.

Basswood below Gifford Hall and Mead Chapel

Another tree with a compromised root system was a Poplar growing out of a stone wall behind the Hadley House Barn. One of our crew members commented how the roots went right through the wall, and this was a good reason to remove sucker trees before they get too large.

Poplar Tree at Hadley House
The rotting root system in the wall

Overall, we did fine. Here’s another couple of pictures of some damage, we’ll have it cleaned up in another day or so.

Blue Spruce by Fletcher House

This one was tricky. A Black Maple on the east side of Old Chapel lost a large limb, breaking another couple, but the limb was held up in the tree by an old cabling system, so extracting the limb from the tree involved some minor rigging and rope work.

Last picture-weeping willows always look so dramatic when broken. This one, located behind the esteemed Francois’ house, lost two major limbs, but had the good grace to avoid the power line right below. He and his dog watched it fall. No, the dog was not in the crate at the time…

A Wednesday Thunderstorm

Last wednesday we had a rip-banger. Thunderstorms developed in the hot summer air over Northern New York, and built as they tracked across the lake. The line continued to build once across the lake, and erupted on top of Middlebury.

I was sitting at home, (I was at work early), watching lightening strike all around us, many up on the ridge of Snake Mountain, some in the fields below. The wind was howling, and sheets of rain poured down. The Middlebury weather station recorded a 20 degree temperature drop in less than a half of an hour, and more than a half an inch of rain in the same amount of time. Peak wind gust came in at 40 mph.

The college weathered the storm ok, but 3 trees took it quite hard. A Green Ash behind Emma Willard (Admissions) took a lightning strike-that was interesting, as it was the shortest tree around, but it was all by itself in the center of the back yard.

Another tree we lost, not surprising, but still sad, was a large Weeping Willow on the northwest side of Battell Beach (the upper Quidditch Pitch). We almost always see Adirondack chairs underneath this tree. The center two stems of this tree had a fast moving fungus that caused a rot in the sapwood of the two center trunks. The sapwood is what carries water upwards to the branches, as well as nutrients throughout the tree, so having this vital structure rot away was a irrecoverable death in waiting. High winds torqued one of the trunks, and broke it away to lean against one of the remaining ones. We removed the tree the next day, before it broke further on someone sitting in a chair.

The final tree may or may not be a casualty, time will tell. One of the large Norway spruces we left in the Main Quad Tree Removal, the most southern one, was hit by lightning. Friends at work in the service building told me it was the most impressive lightning strike they’d heard in a long time. The tree shows a classic spiral scar from the top of the tree all the way down to the bottom root flare. Bark like shrapnel was scattered all over the quad in long 3′ strips, and filled the back of one of our gators. The prognosis of the tree is unknown. The roots seem to be intact-while there is bark peeling on the root flare, it does not seem too bad. Certainly I’ve seen trees recover from worse. We’ll know in a couple of weeks-if the tree is going to die quickly we’ll know soon.

Lake Flooding

We’re a little removed from Lake Champlain up in Middlebury, but probably not as far as you think. My own house sits above the Lemon Fair River, draining into the Otter Creek north of Middlebury, which empties into Lake Champlain just north of Vergennes. The lake itself also drains to the north, out the St. Laurence Seaway, which seems counter-intuitive. Everything is supposed to flow south and down, right? Wikipedia says the residence time (the amount of time the lake turns itself over) is 3.3 years. That’s some serious water flow.

The lake peaked a day or so ago at 103.25 feet, that’s the elevation above sea level. It is considered above flood stage at anything over 100′, and seems to spend most of the summer at about 95.5′ above sea level. That means the lake is 7 3/4 feet (!) higher than normal. The previous record, which I remember from a job being a caretaker on a lakefront property, was 101.88′. So all that snow we were cursing this winter? It’s still around.

The Lake Champlain Basin Program has a picture gallery up of flooding and sediment flow that’s worth a look, and below is an animated GIF from the National Weather Service of Hi-Res satellite pictures of the snow melting off the Green Mountains.

Some snow

The most remarkable thing about this last snow storm on Monday is probably the fact I almost didn’t write about it. After this punishing winter of snow removal, yet another storm didn’t seem worthy of taking the time to whine. But, after setting some records, I thought I’d write about it, if only so students can brag to their parents.

We don’t know how much snow we got here on campus, as the wind was drifting the snow so radically that some places were devoid of snow, while others were 6′ deep in drifts. I asked the guys in the landscape department how much snow we got, and the answers are unprintable. I measured 20″ in my driveway, but that was pretty windblown too. According to the National Weather Service, Cornwall got 22″, Bridport 24″, so we’re thinking somewhere in that neighborhood sounds about right.

Snow Totals Map-click for larger version

This is one for the record books, both the storm and this winter. The Burlington Weather Service office recorded 25.8″ of snow, beating our Valentine’s Day storm of 2007 by a tenth of an inch. (Incidentally, the record storm was last year, January 2-3, where they got 33.1″. I’ve erased that from my memory) This is the largest March storm, however.

In terms of our yearly records, we’re at 124.3″, third highest total. Number two comes in at 132″, in 1886-87, and the record holds at 145.4″, in 1970-71. I can see us beating 1886, but if we break the ’70 record there is going to be some sore shovelers at Middlebury.

Speaking of sore, yes, there are still some sidewalks not cleared yet. We’re trying! The problem with massive snows like this is that our regular plows just can’t handle it. You can only push a huge pile of snow for so long before the wheels start spinning or you have nowhere to put it. For these types of events we put large snowblowers on a couple of our tractors, but that’s slow going too. And because classes were still being held, the extra sidewalk traffic impeded progress all the more. Uncleared sidewalks means snow shovelers are walking through snow from building to building, dragging a snowblower through drifts.

And on top of all of that, a lot of us couldn’t even get to work. For the most part, the only workers that made it in lived in Middlebury, except for snow miraculous sidewalk tractor operators, who I’m thinking were airlifted in. My own road was roughly plowed by a Monument Farms tractor half the size of my house-the cows have to be fed-but the town plow didn’t make it until the end of the storm Monday evening.

Tired of the snow? If it makes you feel any better, the stake at the summit at the top of Mount Mansfield says they’ve got 90″. That’ll be there a while.

This Winter, explained.

Some of our winter weather is controlled by a weather oscilliation know as the North Atlantic Oscilliation, or NAO. This is defined by the difference in atmospheric pressure between an area above Iceland and above the Azores. Ordinarily, low pressure in the winter sits over Iceland, and high pressure over the Azores, and this creates the Polar Vortex, which is simply wind and weather spinning counter-clockwise around the north pole. Picture the two pressure systems as gate keepers, keeping the cold wind spinning around the pole. This strong low pressure over Iceland also draws air from the south west across Eastern North America, giving us somewhat more mild air. Weather scientists call this a teleconnection, or linking of pressure systems across broad geography.

This winter, extraordinary high pressure sat over Greenland, matched by high pressure over Alaska. This caused a breakdown in the polar vortex, causing cold arctic air to dump southward, on top of us. This cold air spilling south is replaced by warmer continental air. A similar event happened last winter as well. Scientists are blaming our colder than normal temperatures and our increased precipitation on this unusual pattern.  Much research is taking place now on this event, known as a Warm Arctic/ Cold Continent.

Average Pressure Pattern
High Pressure, February 2010

The reason for this is a disturbing lack of arctic ice. In January, there was a record setting amount of missing ice in the Arctic, about twice the size of Texas. In the summer, more heat is absorbed by the ocean, which releases in the fall, warming the air above and causing the high pressure. Ocean temperatures are well documented to influence weather patterns, such as the El Nino events, or even hurricane patterns in the Atlantic ocean. And most weather researchers are laying the blame of the lack of arctic ice right at the feet of global warming.

This weather pattern has been breaking down the last couple of weeks, as low pressure is forming in the arctic, creating more sea ice, keeping the cold air locked in the polar vortex. It may be that the groundhog was correct, and our exceptionally snowy and cold winter may be coming to an end.

Snow Days

Luther Tenny (Facilities Snow Guru, and master of the Snow Plan) keeps much better track of snow storms than I. The weather station down at the track records liquid precipitation year round, thanks to a small heater melting snow in the rain guage. This has recorded .91″ so far in January, compared to 1.35″ to date last year. In December, 1.92″ of precip. fell, as compared to 1.5″ in 2009. The difference this winter seems to be frequency.

Luther reports 11 snow events so far this year, a snow event being one all of facilities needs to respond to. An average winter contains 18 snow events in total. He also states 19 of the last 20 days in January has seen some snow, and 24 of the 31 days in December.

I never got around to posting this, but here’s a great satellite picture of the nor’easter that hit us on January 12. I’ve lost the name of the site it came from, but I remember it’s from the National Weather Service. We’re in a break from snow now, as the bottom seems to be dropping out of the thermometer. Some of the coldest arctic air we’ve seen in 2-3 years is plunging south, so stay warm.

Magic (Salt)

We’ve had quite the snow week, even though it rapidly disappeared in the rain Sunday. I’ve written about how we remove snow in the past, it’s one of my favorite posts. And what I said certainly still holds true, that a job well done means that no one really noticed we did anything at all. Presto, the roads and sidewalks are clear. This year, we’ve made it a little easier for ourselves, and for the environment, with clearer and safer surfaces to boot.

The issue with snow and ice is always one of traction. Getting rid of most of the snow is relatively easy. Shovels, plows, snow blowers, brooms, even backpack blowers are all used, depending on conditions. The challenge in the winter is the last 1/4″ or so, the snow or ice remaining that doesn’t want to go anywhere. The problem is warmth, and the fact that the very first snow that falls on sidewalks or roads bonds to the surface, and can be very hard to scrape away and remove. This is what makes winter treacherous, and what makes walking and driving difficult.

In the past, Facilities Services has used sand, and a lot of it. Spread on top of this bonded snow/ice hard pack, the sand gives traction on top, making the walk or road a little less slippery. Most of the time. Sand comes with costs, though, some obvious, some not so much. Sand use in winter is linked to phosphorous loading in streams, sedimentation buildup in catch basins, retention ponds, and waterways, and even airborne pollution, as the cars and trucks driving across the sanded surface grind the particulates into finer particles and allow them to become airborne. But the worst part of sand? The carbon footprint, not only in spreading a heavy product, but repeated trips to refill, the continual scraping of the surface to try and remove the leftover hardpack repeated over days, and worst of all, the massive amount of work and fuel required in the spring to clean all the sand up. After all that work, there is still snow and ice left on the walk. The sand seems to disappear, moving off the hardpack to the edge, and the walks are slippery again.

The other solution to the ice problem is to get rid of it, frequently by melting it. In a bulk scale, this usually involves rock salt. Ever make homemade ice cream? Rock salt lower the freezing point of ice, so that it stays liquid at a colder temperature, allowing the milk to freeze. Applied to a road, the salt thaws the ice or snow hardpack, where it runs off as water, drying the road. This certainly has it’s problems too, not only in the carbon footprint to get salt across the country, but in effects both in water and soil of excessive salts. There are other ice melter products, from calcium chlorides to magnesium blends used on airport runways, but most bulk applications still rely on plain old salt.

Facilities wasn’t satisfied with sand, as anybody walking across our sidewalks in the past might attest to, but we weren’t sure about salt, not wanting to make an environmentally worse choice. (It’s neck and neck, actually, between sand and salt, if you actually take the time to weigh the pros and cons.) A couple of years ago we started using Ice Ban as a pretreatment. This liquid is the byproduct from food manufacturing (I believe our source is actually from beer), and sprayed on sidewalks and roads before a storm can prevent the dreaded bond from forming, allowing the snow to be completely removed. This is tricky, though, as conditions need to be perfect in order to apply, and this only seems to be about 2/3-3/4 of our snow events. Then we discovered magic.

Magic Salt is ordinary rock salt treated with ice ban, or an equiviant. This agricultural by-prodcut gets sprayed on the salt, turning it brown and giving it a somewhat funky smell. It makes the freezing point of water drop even lower, meaning less treated salt is needed to melt the equivalent amount of snow or ice. Some estimates claim 30-50% less. And much much less sand/salt mix, up to 3 times less. Less product=less carbon. And we’ve got cleaner sidewalks. This is our first year of trying Magic Salt, and so far we’re impressed. But don’t take my word for it, the proof is in the pictures.

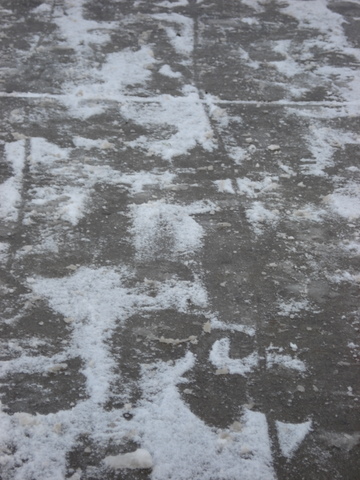
Here’s a sidewalk treated conventionally with ordinary rock salt (not by the college). Yes, the sidewalk is clear, but note not only the chunks of excessive salt remaining, but the white residue of the salt on the walk. It’s very easy to over apply salt.

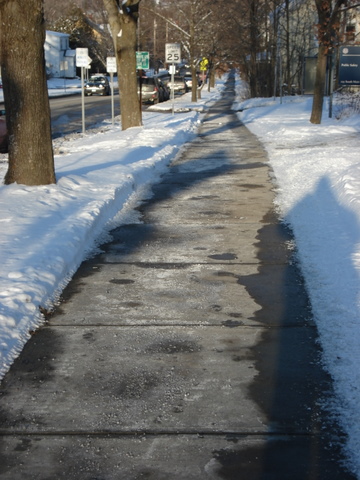
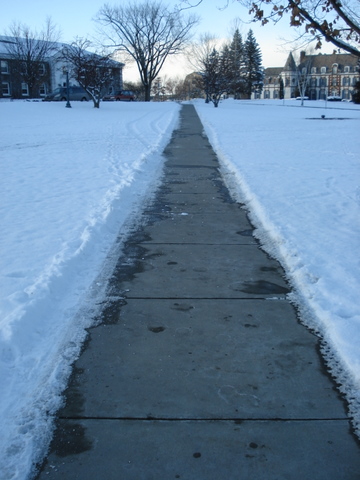
This is one of our walks, treated with Magic Salt. Very clear, but notice there is no excess salt on the surface, and no white buildup of salts on the sidewalk either.

One night this week it snowed on top of cleared sidewalks in the middle of the night, and night time temperatures were in the single digits. Temperatures this cold are below the effectiveness of straight salt, it just won’t melt the snow. The sidewalk above was treated with straight rock salt the day before, and you can see the bond that formed between the walk and the snow. There are footprints in the snow above. Compare it to the the picture below.

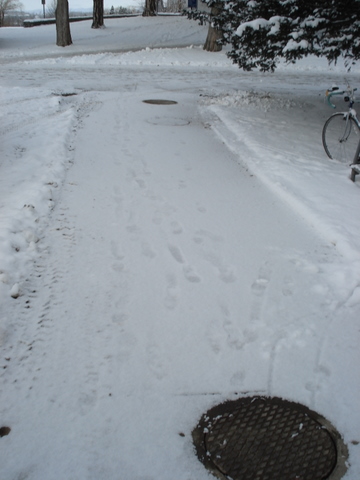
This sidewalk was treated with Magic Salt the day before, and, while it has received more foot traffic than the walk above, you can still see how there is no bond formed. Even walking on this sidewalk was more pleasent, and not as slippery as if the snow had bonded down. And with this type of surface we can…

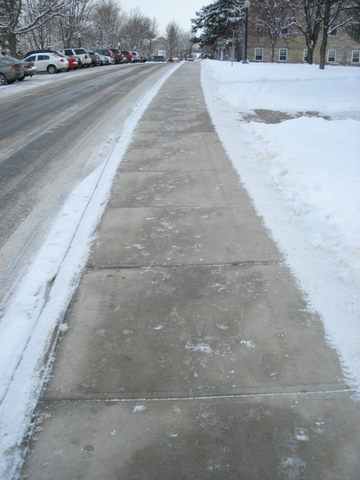
Sweep the walk clear. A broom on one of our tractors came along and in no time at all discovered the bare surface again.

New Breadloaf Weather Station

Thanks to Environmental Council, Facilities Services has installed a second weather station, this one up at Breadloaf campus. It’s hanging on the side of the Laundry shack, next to the really cool old telephone booth. We use weather information from the station on main campus all the time, from worrying about snow removal to tracking growing degree days. Now, not only will we be able to do that for Breadloaf as well, but now us Nordic skiing addicts will be able to plan our waxing for the day on the drive up.

For now, the best place to see the weather information is on the Weather Underground, where we are live streaming the information. They generate a page for the Breadloaf station, as well as Main Campus.

What a Storm

“No enemy but the weather, and the wind, the wind, the wind.” Michael Carey, from “The Thing about Farming”, The Noise the Earth Makes.

We had some wind yesterday. I’m thinking you noticed. Peak wind gust at our Middlebury College Weather Station was recorded at 51 mph, but what I found most impressive was the sustained wind speeds, wind speed averaged over the course of a minute. The highest recorded was 47 mph, but between about 2:30 and 4 the wind averaged between 30-45 mph. That’s impressive.

As you may know, wind is formed by air being pushed between two fronts. Yesterday a strong low pressure system pushed off high pressure off the coast, and the great difference in pressure and speed of the approaching front caused our extreme winds. Looking at the weather graphs for yesterday, you can see the barometric pressure was dropping as the cold front approached, and see the wind speed increasing. The front passes us at 4, and the wind speed dies down.