
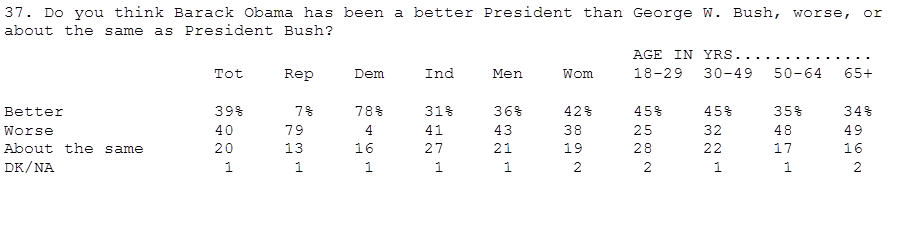
Conservative pundits such as the Wall St. Journal’s Peggy Noonan continue to cite the recent Quinnipiac poll as evidence that Obama is perhaps the worst president to have served during the last seven decades. For reasons I discussed in my previous post, however, I think we need to resist jumping to that conclusion. First, the Quinnipiac survey asks respondents to choose the best, and the worst, president from among the 12 who have served in the post-World War II era, rather than allowing respondents to rank each of them using the same set of standards. Given the degree of partisan sorting among the general public, (and perhaps the public’s lack of historical memory!) we should not be surprised that the two most recent presidents, Obama and Republican George W. Bush, come in first and second, respectively, in the worst president list, and that in a head-to-head comparison of Bush and Obama, Democrats and Republicans present almost mirror images in their choice of the worst president. (Note: contrary to what Sean Trende seems to suggest, this is not evidence that we are a 50-50 nation – see my previous posts on party sorting.)
 As I noted, however, if we simply ask respondents to evaluate each president based on a fixed set of criteria, as in this Gallup poll, rather than comparing them in order to choose the best or worst, Obama fares much better. So question wording against the backdrop of recent partisan sorting is almost certainly what is driving the Quinnipiac result. It is the same phenomenon that, as I discussed here, makes these two presidents the most polarizing in recent history.
My second concern is that it is simply too early to put much stock in the stability of the public’s evaluation of Obama’s presidency. Opinions regarding a president’s performance can and do change. As evidence, consider the following chart put together by Tina Berger that tracks the net approval difference across time in Gallup polls asking the general public to rate presidents on a five-point scale, from “outstanding” to “poor”. (Tina combined the “outstanding” and “above average” ratings, and the “below average” and “poor ratings”, and subtracted the second total from the first to calculate the net difference.)
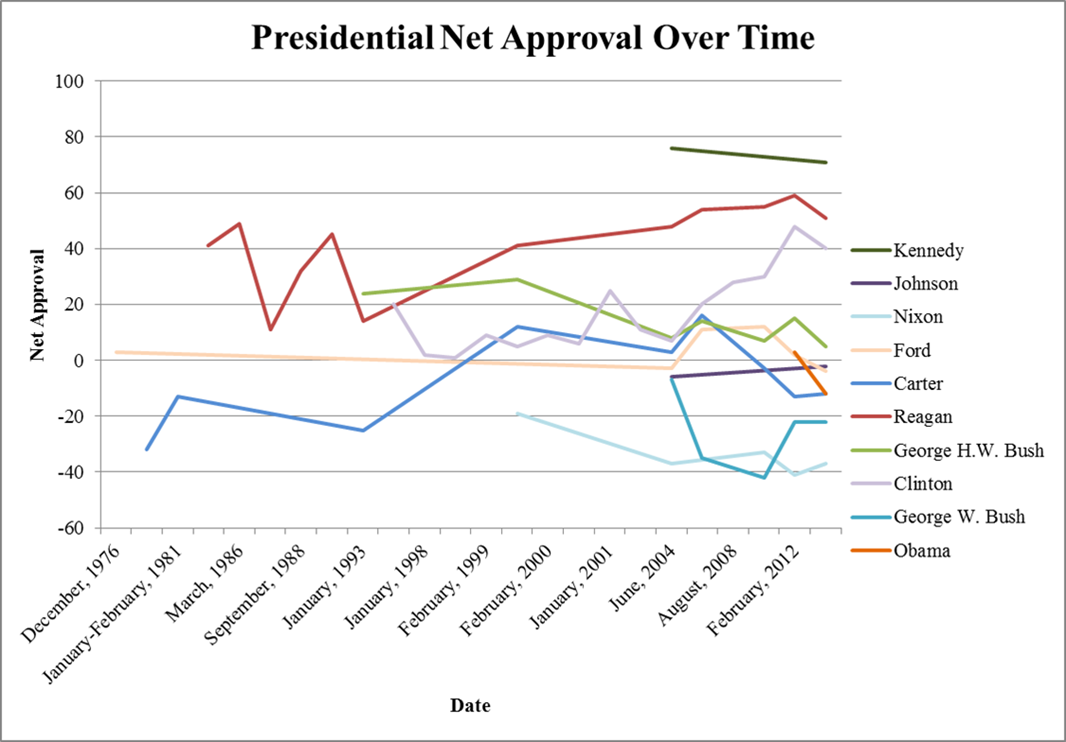
As you can see, both Reagan and Clinton have seen their net approval ratings climb some 20 points from where they stood in polling that occurred during their presidencies. That climb, I suggested in my last post, largely reflects the public’s growing appreciation of the sustained economic growth during their respective presidencies. Note that Nixon, Carter and George W. Bush all have net negative ratings, while Kennedy’s (based on only two polls) and George H. W. Bush’s are consistently positive (along with Clinton and Reagan). Ford and Carter, meanwhile, straddle the break-even line.
With the exception of Ford, note that none of these presidents’ net favorability ratings today are close to where they began when Gallup polled during their respective presidencies. Some of that fluctuation is driven by new stories that momentarily focus public attention on a particular president, but it also reflects more fundamental opinion change as the presidents’ historical record comes into focus. Given this, is it conceivable that Obama’s net favorability will mimic Reagan and Clinton’s positive trends? To date Gallup has included Obama in only two of these particular polling exercises, so it is too early to draw lasting conclusions regarding where he will end up. But if the unemployment levels continue to fall throughout the last two-plus years of his presidency against the backdrop of an accelerating economic recovery, I would not be surprised to see Obama move squarely back into the positive favorability range. At that point no one – not even the partisan pundits – will be paying much attention to the Quinnipiac poll.