Tag Archives: midterm forecast

The Midterm Elections: A Choice, or a Referendum?

Two weeks ago Democrats’ hopes for the midterm elections were briefly raised when the Gallup generic ballot came back showing a dead heat, 46%-46%, in voters’ preferences between the two parties. Some progressive media sites, buoyed by the poll, wondered why it did not receive more press coverage.  Alas for Democrats, the most recent Gallup survey puts Republicans back up by 5%, 48%-43%, a margin that is identical to the average lead held by Republicans in the Gallup poll since the start of August.  I’ve written before about the need to view one-time fluctuations in the generic ballot results with caution, and the latest results are a reminder that, despite these fluctuations, for the most part Republicans have lead in the generic ballot for almost two months.  This is important, because as I’ve also discussed in previous posts, the generic ballot results are a useful, if not infallible, tool for predicting the actual midterm results.  As I noted in my previous post, several of the midterm forecast models developed by political scientists incorporate the generic results, and these are the ones that suggest Republicans are poised to gain upwards of 50 seats in the House come November.

To get a sense of the significance of the generic ballot, I had my research assistant Matt D’Auria plot the final Gallup generic ballots results (the x-axis) against the actual aggregate popular vote (the y-axis) received by the Democrat Party in each midterm election dating back to 1952.  For comparison purposes, he also plotted the results as if the generic result perfectly predicted the actual aggregate support for the Democrats (the red line).

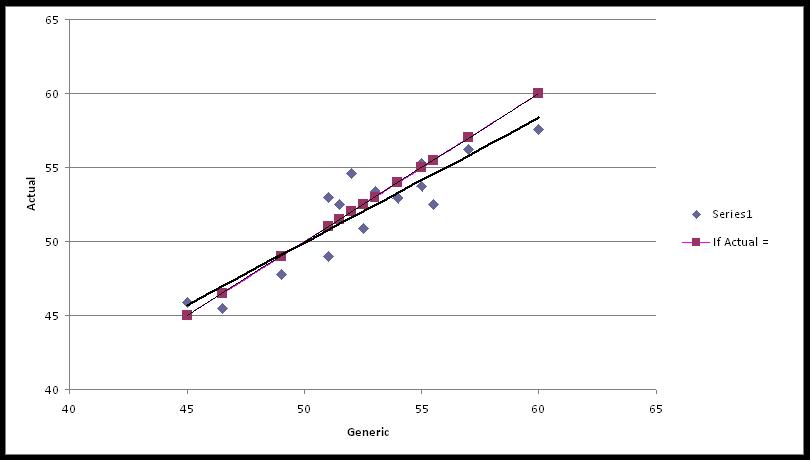
By fitting a regression line to the actual data, we can construct a simple equation that estimates the final popular Democrat vote based on the generic ballot results. If we plug in 43%, which is what Democrats are currently receiving on average in the generic survey, the regression suggests that Democrats will receive 44% of the actual aggregate popular vote in November. That’s actually better than one might expect, given that in most years the actual vote falls below the generic results. (Warning: this is a crude estimate, particularly since the current level of Democrat support is lower than that in any of the previous years’ totals included in our sample.)

However, what we really want to know is how many seats the Democrats are likely to win, assuming – as our crude model does – that they receive 44% of the aggregate popular vote. If we plot previous aggregate support against actual seats won, we can again estimate a very simple regression equation, keeping in mind all the caveats mentioned above.

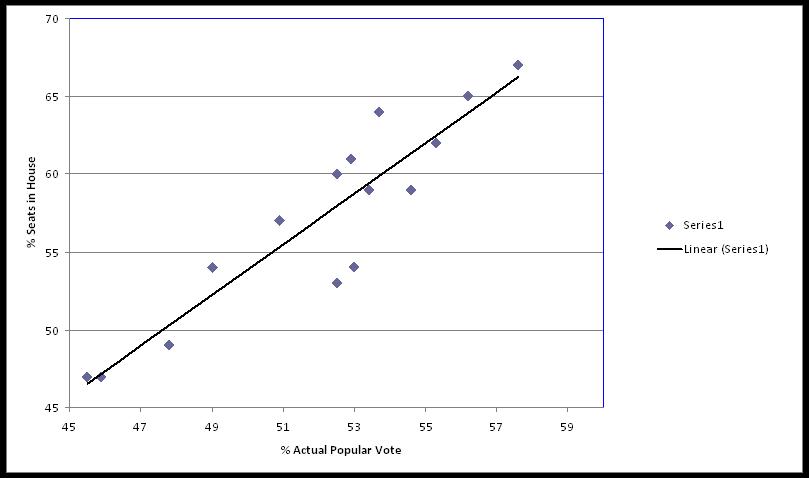
Plugging in our predicted value of 44% popular support for Democrats, our crude model indicates that Democrats will win about 44% of the 435 House seats, or only 191 seats come November – a projected loss of 65 seats!

Now before my Democrat readers slit their tree-hugging wrists, keep in mind that these are very squishy estimates; there’s a large margin of error around this projection.  None of the more sophisticated forecast models of which I am aware forecast Democrats losing 65 seats.  And with a month and half to go before the midterms, the generic ballots results can still change.  Moreover, the simple model I’ve presented here encompasses a long time period during which the underlying dynamics of congressional elections has evolved. However, these long-term changes don’t necessarily help Democrats. Most importantly, as I’ve indicated in previous posts, congressional elections – including midterms – have been increasingly nationalized in recent years.  That is, individual races are more susceptible to broader forces affecting the nation as a whole.  And right now, those broader forces – most notably the lagging economy and ambivalence toward the Obama presidency – are working against Democrats.

This is all a long way of saying that the recent Delaware Senate primary results are, in my view, consistent with a broader picture, one that does not bode well for Democrats in the coming midterm elections. They may not lose 65 seats, but if history repeats, they are likely to lose closer to 40, and their majority, than to 25 which is the post-World War II average.

Is there any way to prevent his from happening?  If I am an individual Democrat in the House from a marginal district (one in which I won with less than 55% of the popular vote) and am running for reelection in this climate, I would fall back on those tactics that traditionally work for incumbents: emphasizing constituency service and name recognition, reminding voters about what Republicans stand for, and distancing myself from the President and his policies.  The goal is to make this election a choice – not a referendum on the party in power.

Predictions, Predictions: Congress and the Courts

How reliable is the generic ballot survey question in helping forecast the size of the Democratic losses that will occur in November?  As we move closer to November 2, a growing proportion of my blog posts will undoubtedly focus on the midterm elections.    Many of these posts will likely mention the generic ballot question that is asked by a number of polling firms.  As most of you know, this question typically take some version of the following form: “Looking ahead to the Congressional elections in November, which party do you plan to vote for if the election were being held today?”  The survey results, as many of you have heard me say, are actually a useful indicator of the likely outcome of the November midterm election.

But how useful? In a recent blog post, Nate Silver at fivethirtyeight.com raised important questions about the utility of the generic ballot question results. Silver writes: “It might be the case that the generic ballot is fairly stable, but that doesn’t necessarily mean it’s all that useful an indicator. In addition to the fact that the consensus of polls (however careful we are about calibrating it) might be off in one or the other direction, there’s also the fact that the thing which the generic ballot is ostensibly trying to predict — the national House popular vote — is relatively irrelevant to the disposition of the chamber, or the number of seats that each party earns.”

Political scientist Alan Abramowitz, (via Brendan Nyhan) takes issue with Silver’s comments, calling portions of them “pretty silly.”  I wouldn’t characterize Silver’s comments as silly, but I certainly disagree with portions of his post, particularly his claim that the national House popular vote is “relatively irrelevant to the …number of seats each party earns.”  Although it is not a perfectly precise indicator of how many seats a particular party will win (or lose) come November, it does provide a useful approximation.  Similarly, the generic ballot question does help us predict, within a margin of error, what the likely popular vote will be come November. To be sure, in some midterms it has proved more useful than others.  But it is not irrelevant.

The bottom line, then, is that the generic ballot results, properly understood, helps us predict the November midterm results. To see why, it helps to understand how political scientists factor the results of this question into their midterm forecast model.

When a generic ballot survey comes back with results showing, as the most recent Gallup survey poll does, that Republicans are favored over Democrats by 7%,  50%-43%, that doesn’t necessarily mean Republicans will win 7% more congressional seats.

Indeed, as Silver correctly points out, the generic ballot result can’t even tell us how many overall votes each party will get in the midterm, never mind how they will do in each of the 435 districts.  But political scientists understand this.  As it turns out, they don’t necessarily have to perform a district-by-district level analysis to get a decent handle on the total number of seats each party will win.  Instead political scientists can use the generic ballot results as one factor in statistical models that also take into account the existing political context as well as “structural” attributes associated with a midterm election.  So, for example, Abramowitz’s midterm forecast model uses only four variables to predict the midterm outcome, as measured by seats lost/gained:  the results of the generic ballot question, presidential popularity (as measured by the Gallup poll), the number of seats held by Republicans going into the midterm election, and a simple indicator variable that signals this is a midterm election, rather than a presidential one.  (This last variable is important because the president’s party typically loses seats in the midterm election.)

How do we know that the Abramowitz model (or others like it) is reliable?  Because it is constructed using previous midterm election results.  In effect, by looking at previous midterms, Abramowitz can build an overall “generic” statistical model that says, on average, how important each of these four variables is in determining the midterm election results.  Then, by plugging the current values for each variable into the existing model, he comes up with a forecast.  Political scientists have constructed different forecast models, but they typically all include some mix of variables that measure voters’ partisan sentiment, structural attributes associated with the midterm, and some indicator of the environment (political and otherwise) in which the election is being held.

Now, these models aren’t completely foolproof.   They are predicated on the assumption that the factors influencing the current midterm will behave pretty much as they have in the past. Say something unexpected happens – terrorists attack the World Trade Center, for example.  That may unexpectedly distort the relative importance of some variables, thus throwing the forecasts slightly off.  Moreover, even without unexpected events, there is always some uncertainty involved with these forecasts – some unexplained variance for which the model cannot account.

But it would be wrong to suggest, as Silver does, that the generic ballot question is “irrelevant.”  In fact, it is a highly relevant and useful predictor of the midterm outcome – as long as it is evaluated within an overall understanding of the factors that drive midterm elections.  And right now, it favors the Republicans by 7% – not a good sign for Democrats at all.

I will have much more to say about the generic ballot in the next several posts.  Before doing so, however, there’s another prediction that I need to discuss: Elena Kagan’s Senate confirmation vote to the U.S. Supreme Court.  Long-time readers will recall that in an earlier post I set the over/under for the Kagan no votes at 35.  In a sign that my predictive powers may be slipping (remember that I nailed Sotomayor’s exact confirmation vote) Kagan was confirmed with 37 votes in opposition, so I was two votes off.  (If you must know, it was Nelson and Brown). Will Loubier, on the other hand, hit the final vote margin squarely on the head, thus winning a Presidential Power “It’s the Fundamentals, Stupid!” t-shirt.   Here’s Will, looking justly proud of his prognosticative abilities:

For the envious among you, note that I’ll be giving away another t-shirt in the “predict the midterm outcome” sweepstakes.  Stay tuned!