
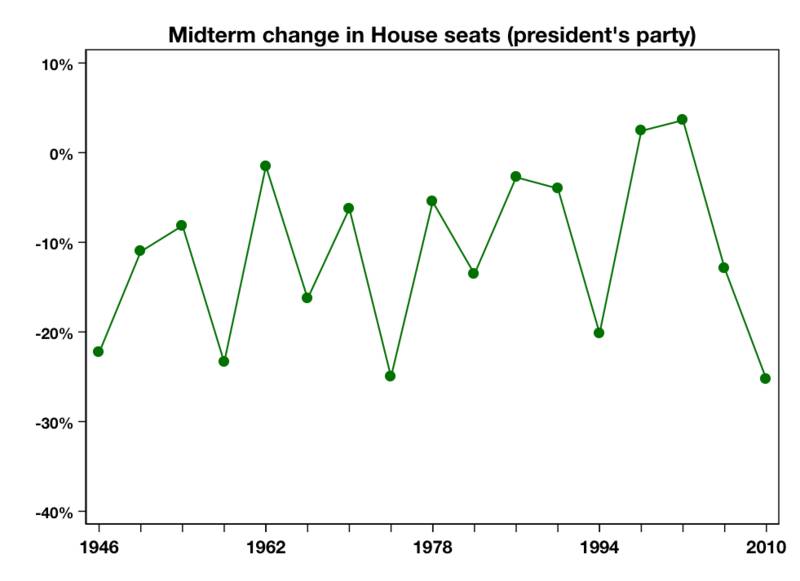
In previous posts (see here and here and here), I noted that the Republican pickup of 63 House seats (with one race still to be determined) was the largest midterm seat gain since 1938 – a gain that almost no political science forecast model really came close to predicting. To be sure, this loss was caused in part by the large number of exposed seats controlled by Democrats. However, as Brendan Nyhan points out (see figure below), even if we measure the Democrat’s loss as a percentage of seats that they controlled going into the 2010 midterm, this was still a “wave” election, with their percent of seats lost rivaled only by the percent the president’s party’s lost during the 1946, 1958 and 1974 midterms. (The chart below shows the percent of the presidents’ party’s seats gained or lost in each midterm dating back to 1946).
In my day-after-the- election analysis, I suggested four reasons why the Republican gains/Democratic losses exceeded expectations: the unprecedented depth and duration of the current unemployment cycle; the impact of several highly publicized and very controversial votes, particularly those dealing with the bank bailout, the stimulus and health care; the increasing nationalization of elections, and the role of the Tea Party, particularly in candidate recruitment.
Today I want to look at the third of these four factors: the nationalization of congressional elections. Most of you are familiar with former House Speaker’s Tip O’Neill’s famous aphorism that “all politics is local.” In fact, however, while that may once have been the case with congressional races, it is increasingly less so. As I have pointed out in several previous posts, the relative influence of national factors in both presidential and midterm congressional elections has been on the rise for several decades. This means that in recent elections the outcome in any single congressional district is more likely to be driven by factors outside of that district.
The question is: did the 2010 midterm continue the trend toward the nationalization of congressional elections? To find out, I regressed the share of the Democratic vote in each congressional district in 2010 against both the Democratic share of the congressional vote and the vote for Obama in each district in 2008, while controlling for whether an incumbent was running and whether a Democrat had won the district in 2008.* (I dropped from my analysis any race in which a candidate ran unopposed.) The idea here is to see how much of the 2010 vote in each congressional district can be “explained” by support for Obama in that district in 2008 – that’s the “national” coefficient – and how much is due to the district-level Democrat vote for the representative in 2008 – the “local” coefficient. As the following chart indicates, the 2010 midterm was the most nationalized election in 54 years. (I don’t have district-level data going back before 1954)
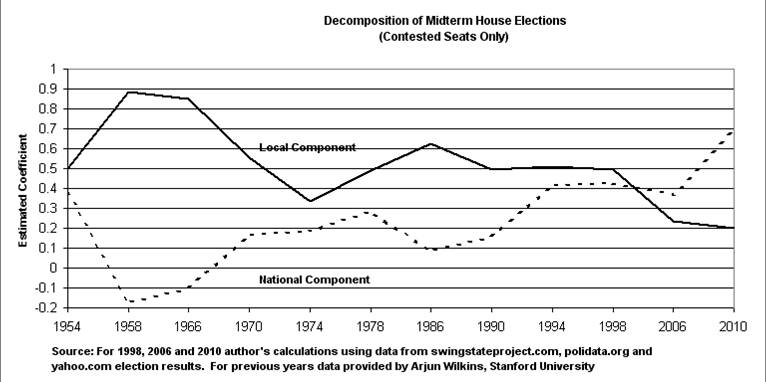 Moreover, this is the second midterm election in a row in which national factors have outweighed local ones in influencing House races, and the fifth in a row if we included presidential election years. (Figures for 2002 aren’t included because of the redrawing of district lines after the 2000 census.) This after a more than 40-year period in which local forces dominated House races. Clearly we are witnessing a significant restructuring of the nation’s electoral dynamics.
Of course, in light of my two previous posts, the fact that the 2010 midterm was the most nationalized in more than half a century should not surprise us. The depth and duration of the current unemployment cycle and the high profile and exceedingly controversial pieces of legislation I cited above by themselves were likely to “nationalize” voters’ calculations. As I’ve shown in previous posts, both worked against the Democrats as the party in power. These immediate influences augmented several long-term trends that have contributed to the nationalization of congressional elections, including changes in campaign finance regulations and the increasing polarization of Congress due to the loss of conservative Democrats and moderate Republicans. The net impact of recent campaign finance reforms has encouraged congressional candidates to look outside their own districts for funding by tapping into more ideologically-oriented issue activists. In the more polarized Congress, meanwhile, members’ ideology increasingly matches up with their party labels; the Republican Party in Congress is more uniformly conservative, and the Democrats more liberal. Seeing two ideologically extreme parties, the more moderate voters may – and I stress may – be exhibiting less patience with either party, and instead are more willing to throw the majority party out when things are not going well.
If my analysis is right, it suggests that political science forecast models predicated on past elections going back several decades may underestimate voter volatility in the current electoral era. In a future post I’ll address whether the swing in House seats has become greater and more uniform in recent elections. But it does raise interesting issues as we look toward the 2012 elections, particularly in trying to understand how increased voter volatility – if it exists – might affect Obama’s reelection chances. I’ll take up this topic in a future post as well.
I should add, however, that in one respect the 2010 midterm results were actually quite familiar: they ushered in still another two-year period of divided government, in which at least one congressional chamber is not controlled by the president’s party. Dating back to 1946, voters have divided power for 40 out of 66 years, or 61% of the time. Since 1969, we have experienced unified control of the presidency and Congress for only a dozen years – a 30% rate of single-party control. The real message from 2010, then, may be that in an increasingly polarized environment, voters – displeased with both parties – are once again hedging their bets by dividing governmental control.
*My thanks to Matt D’Auria, Sarah Pfander and Owen Witek for providing the district-level vote totals.