Tag Archives: approval ratings

Are Obama’s Approval Ratings On The Rise?

An apparent uptick in President Obama’s Gallup Poll approval ratings triggered a flurry of stories these past two days speculating what might have caused the change and what it portends for the future.  Politico’s story was headlined Obama job approval surges, while the Hill was a bit more restrained noting only a “jump” in Obama’s approval ratings.  Many other pundits weighed in as well, with several attributing Obama’s polling rise to his “victory” in the payroll tax cut extension debate with House Republicans.

But were the headlines warranted? Did Obama really experience a significant uptick in his popular support?  You decide. Here are the Gallup numbers from the past two weeks that were driving many of these stories. The second column are his approval numbers, and the third his disapproval.

12/13-15/2011

41

51

12/14-17/2011

42

51

12/16-18/2011

42

50

12/17-19/2011

43

50

12/18-20/2011

43

49

12/19-21/2011

43

48

12/20-22/2011

44

48

12/21-23/2011

47

45

12/22-26/2011

46

48


All told since mid-December, his approval ratings have gone up about 4-5%, and his disapproval ratings have dropped by about 3%.  When we consider the random variation inherent in the sampling that produces these polls (the tracking poll has a margin of error of +/-3%), it appears that Obama’s approval ratings may have ticked up a hair – but it is hardly enough to warrant headlines heralding a polling surge or jump.  So why the sudden focus on what appears to be a slight uptick at best?  It’s primarily due to that one-day result in Gallup’s three-day tracking poll indicating that, for the first time since July, his approval ratings were – barely – higher than his disapproval ratings, at 47-45.  Substantively, that number was really no different from what came the day before, and what followed the next day.  But psychologically, the fact that his approval was higher than his disapproval – even if for only one day! – was a big boost to the President’s backers, and it prompted a flurry of news stories speculating that Obama may have received a significant and enduring boost in support due to the recent “victory” over House Republicans.

Of course, we’ve been through this before. Remember this TPM headline from this past January? That was after the extension of the Bush tax cuts and Obama’s post-Gifford’s shooting speech had progressives in a tizzy that we were witnessing a game-changing upswing in Obama’s poll numbers.   It never happened. Nor did Bin Laden’s killing produce more than a momentary spike in the President’s approval ratings.  So what has caused this latest upturn – if we can even call it that? My guess – and it’s primarily a guess – is that the slight uptick in his Gallup numbers are driven primarily by the better unemployment figures that came out earlier this month and have little to do with the payroll tax cut extension.

However, this good news notwithstanding, without a major and sustained uptick in the economic numbers, Obama’s approval  ratings aren’t going to change much from where they have been for the past several months – mired in the mid-to-low 40’s range.  And this is not a good place to be. Historically, Obama’s November polling average was among the lowest ever recorded for a president at this point in his term, and his December poll numbers are not, at this stage, looking much better unless the latest numbers are in fact a harbinger of things to come.

Indeed, at this juncture Obama is on track to have the lowest December, third-year approval ratings of any president since Gallup began public approval surveys.

The bottom line is this: don’t be fooled by the Beltway spin regarding purported winners and losers based on pundits’ scorecards that judge one high-profile event.  For Joe Sixpack and his wife Jane, it’s still the economy, stupid.

Reagan, Obama and the Myth of the Teflon Presidency

Last Sunday marked the centennial of Ronald Reagan’s birth.  The anniversary occasioned numerous tributes and remembrances, most of which noted Reagan’s celebrated skills as the “Great Communicator” and his reputation for developing a “Teflon Presidency” – one that somehow escaped blame for the economic problems of the day.  That latter sobriquet was coined by Democratic Congresswoman Pat Schroeder in a 1983 speech on the House floor, when she said of then President Reagan: “He has been perfecting the Teflon-coated presidency: He sees to it that nothing sticks to him.” Schroeder’s exasperation was shared by many Democrats at the time, and it is a characterization that, as last Sunday’s remembrances indicates, has only grown more widespread through the intervening years.

What is the source of the Teflon-like qualities attributed to Reagan’s presidency?  In a editorial in Sunday’s USA Today, Schroeder explains: “Why was Reagan so blame-free? The answer can be found in the label that did stick to him — “The Great Communicator. Reagan’s ability to connect with Americans was coveted by every politician. He could deliver a speech with such sincerity. And his staff was brilliant in playing up his strengths. They made sure the setting for any speech perfectly captured, re-emphasized and embraced the theme of that speech. And, let’s be honest, Reagan told people what they wanted to hear.”

She concludes: “…Reagan’s incredible ability to communicate and his staff’s genius in exploiting that ability are the reasons his presidency will be sealed forever in a Teflon coat.”

Schroeder’s characterization, as Sunday’s remembrances remind, is shared by many.  It is also completely wrong.  In fact, Reagan did not escape blame for the economic recession, high unemployment and other problems that occurred on his watch. Instead, the dynamics driving changes in his popularity were largely the same as those governing approval ratings of most presidents – including Barack Obama. Note that he left office with a lower average approval rating (based on Gallup polling) than his three successors: George H.W. Bush, Bill Clinton and George W. Bush. That average, of course, masks tremendous variation in his month-to-month ratings, as  these Gallup Poll surveys indicate:

It is true that he left office slightly more popular than when he entered – one of the very few modern presidents who can make this claim.  But clearly his popularity was not static. Instead, we see a slow but steady decline from a peak of near 70% shortly after the failed attempt on his life early in his administration to a low of 35% in January, 1983.  Thereafter it begins a steady rise before enduring a steep, sudden decline in 1985.  That is followed by a slight recovery to a peak of 68% in May of 1986, but he suffers another decline in 1987 that brings him down to about 50%, where he remains until benefiting from the typical post-election bounce as a lame duck president.

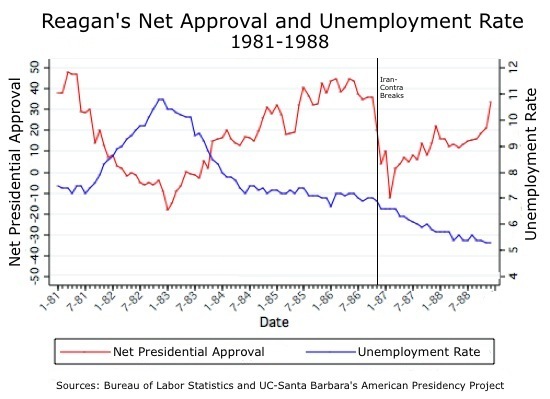
So much for the approval numbers. What explains them?  Greatly simplified, the answer is jobs and Iran-contra.  Consider the following chart (courtesy of Jay Cost).

We see that Reagan’s net popular approval (approval minus disapproval) is almost the mirror image of the national unemployment rate – when unemployment goes up, his net approval drops.  And for most of his first term, the nation was experiencing a severe job loss, one largely induced by the Fed’s stringent monetary policies designed to wring inflation out of the economy.  The result was that by 1982 unemployment had reached record post-World War II levels, averaging 9.7%, and remaining high, at 9.6% on average through 1983.  Even though inflation dropped from a yearly average of 9.2% in 1981 to 3.8% in 1983, Reagan paid a steep political price for the job loss, despite the fact that the economic conditions were arguably driven more by the Fed’s actions than by his.  The Republican Party also suffered, losing 26 seats in the 1982 midterm elections despite raising far more money than Democrats. This was a bigger than typical midterm loss (although smaller than one might expect given the horrendous unemployment figures).  It was not until job growth began that Reagan’s approval ratings reversed course, and he cruised to reelection with a landslide victory in 1984.

The Iran-contra affair – Reagan’s ill-fated attempt to trade arms for hostages, and to funnel “residual” payments to the contras in Nicaragua – provided the second huge influence on Reagan’s popularity. When that scandal broke in 1985, Reagan suffered the greatest one-month drop in approval ever recorded for any president. Although he regained some of that support, he suffered another hit when the Democratically-controlled Congress released its summary report of the affair, which roundly criticized Reagan, in 1987.

The mistaken belief that Reagan’s presidency exhibited Teflon-like qualities is more than a misreading of history – it also contributes to a misperception regarding Obama’s popularity.  Early in his first term, when his approval ratings remained above 60% despite high unemployment, political analyst Steve Kornacki wondered whether Obama was exhibiting a Reaganesque-Teflon touch. As Obama’s approval ratings began a steady decline, however, analysts changed their tune, with many pondering why Obama had suddenly lost the communication mojo that had characterized his successful presidential campaign.  Some even suggested that the public – influenced by unusually negative news coverage – was holding Obama to a more stringent standard, in part due to his race.  After all, Reagan had also experienced high unemployment, but his approval ratings – thanks to that mystical “Teflon” – seemingly remained impervious to the bad news.

Alas, those who misread history are condemned to misuse it.  Obama – like the Great Communicator before him – has discovered that no amount of “hope and changey” rhetoric can overcome the negative political impact of persistent 9-plus unemployment.  A Teflon presidency?  That’s the wrong material.  Think Velcro instead – when problems of national magnitude occur – they stick to the President, whether justified or not.   If Obama is to make a Reagan-like political recovery, it won’t be because he suddenly rediscovers his communication skills – it will be due to a steady drop in the unemployment rate.

Obama, Approval Ratings and Presidential Honeymoons

The venerable Gallup Poll released its first approval polling numbers for the Obama presidency yesterday.  As most of you know, since FDR’s presidency Gallup has been asking a random sample of the American public “Do you approve or disapprove of the way [president’s name] is handling his job as president?”  (Gallup actually began presidential approval polling in the 1930’s, but didn’t settle on this wording until FDR’s third term and didn’t begin regular monthly polling until  the start of Truman’s presidency in 1945).

According to Gallup, 68% of Americans surveyed from Jan. 21-23, 2009 approved of the job Obama was doing, while only 12% disapproved, with another 21% expressing no opinion. Over the course of Obama’s presidency, versions of this question will be asked by news organizations on an almost weekly basis, and the results will be mistakenly trumpeted by the news media and the punditocracy as a useful barometer of how well Obama is doing his job.  Given the ubiquity of approval polling, I thought it worthwhile to put these initial results in their historical context, as a first step in understanding the sources of a president’s popularity and how those numbers are driven by influences that have little to do with a president’s job performance.

.

Because only Gallup has polling data going back to FDR, I will focus on the Gallup data.

Here are the initial approval figures for the 9 presidents first elected to office in the post-FDR “modern” presidential era.  How does Obama’s approval rating compare?

Year

Dates

President

Approval %

Disapproval %

No Opinion

1953

Feb. 1-5

Eisenhower

68

7

25

1961

Feb. 10-15

Kennedy

72

6

22

1969

Jan. 23-28

Nixon

59

5

36

1977

Feb. 4-7

Carter

66

8

26

1981

Jan. 30- Feb. 2

Reagan

51

13

36

1989

Jan. 24-26

Bush

51

6

43

1993

Jan. 24-26

Clinton

58

20

22

2001

Feb. 1-4

Bush II

57

25

18

2009

Jan. 21-23

Obama

68

12

21

To begin, Obama’s first rating is tied with Eisenhower for the second highest initial approval, and is about 7% above the average of 61.1% approval for this cohort. Kennedy’s rating of 72% is the highest.  It’s no coincidence, I think, that Obama and JFK have the two highest initial approval ratings – both are presidents whose elections broke longstanding barriers to the nation’s highest office.

Interestingly, however, Obama’s disapproval is no lower than the average of 11.1%, and, in fact, 5 of the 9 presidents had lower DISapproval ratings than Obama’s. The percentage of respondents with no opinion of Obama’s performance is almost 7% lower than the average of 27.7%.  Only 1 president entered office with fewer people having no opinion of his performance: Obama’s predecessor George W. Bush.

We see then, that Obama takes office with fully 79% of Americans already willing to express an opinion of his performance, three days into the job. This is the second highest proportion ever recorded this early in a presidency.  It reflects, I think, the ever escalating media coverage of the presidential selection process and the transition period. In this era of 24-7 news coverage, augmented by a highly partisan blogosphere, Americans have more information by which to make an initial judgment of the president’s performance. That Obama starts office with a historically high level of support bodes well for his presidency, particularly given the high number of people who are willing to express an opinion. On the other hand, we also see that he is, comparatively speaking, already a somewhat polarizing figure, much like his two predecessors were at this stage of their presidencies.

Note, however, that these initial judgments are still highly malleable. Obama is currently experiencing the presidential “honeymoon” – an initial period of inflated support for the new president that can last for several months before it begins inevitably to dissipate.  Given the historic nature of his election, we ought not to be surprised that his initial approval is so high.  And this should remind us that approval ratings are driven by factors that have little to do with the president’s actions in office.

Given this high level of support, why do I predict that it will dissipate? Note that Obama won slightly less than 53% of the popular vote. As of now, then, he’s attracting support of roughly 15% of Americans who are not “naturally” inclined to support him. This is what we mean by a presidential honeymoon period; during this initial phase of the presidency, we project our highest hopes on the president. With no evidence to the contrary, we believe that he will fulfill all our expectations. (He will close Gitmo! He will restore American respect abroad and protect civil liberties at home! I know he’ll have combat troops out of Iraq in 16 months!) For those of you who are married, think back to your honeymoon.  When did it dawn on you that your spouse might be less than perfect?  How soon before you noted how (s)he squeezed the toothpaste tube from the middle and left the toilet seat up/down?  So it is, inevitably, with presidents – the reality of the marriage can’t possibly live up to the unrealistic expectations nurtured during the honeymoon.  At some point, we will catch him in the political equivalent of passing wind at the dinner table, and the bloom will be off the rose.

There is a second problem with the honeymoon beyond the inevitable disillusionment. Because of these high honeymoon-induced approval ratings, and the media’s tendency to use the first 100 days as an initial measuring rod to gauge presidential success, presidents often feel pressured in this span to move quickly to pass their major legislative initiatives through Congress.  That impulse, and the use of the 100 Days yardstick, I will argue in a later post, is a mistake.  In 1993 it caused no little grief for the Clinton presidency when they promised to produce legislation for health care reform within the first 100 Days of their presidency, only to completely miss the deadline. It was the first sign that health care reform would not go well. Obama ought to downplay the 100 Day measuring rod at all costs .

More generally, we can expect Obama’s honeymoon to last 3 to 6 months, during which he may actually gain up to 5% in approval support before that number begins to erode. Indeed, if we pool prior presidencies to produce a “generic” presidential approval trend and use that to predict how Obama’s approval plays out, we would expect the following: his approval rating will remain high, in the 60% range, for at least the next three months or so, at which point it will begin eroding at a relatively constant rate through his first term.  Note that this rate of decline will mirror George W. Bush’s loss of support after 9-11, although Bush started from a higher approval point due to the rally round the flag impact of the terrorist strike. Expect Obama to lose between 10 to 20% approval support in his first two years in office. Somewhere in Obama’s 3rd year he will shift to reelection mode, at which point his approval will begin to climb a bit until the 2012 presidential election.

All this assumes, of course, that Obama’s support mimics in its broad outline the approval trends of previous presidents. But why would this be the case?  Isn’t each presidency unique, with its own approval dynamics?  Although there are unique (and unpredictable) aspects to each presidency – see 9-11! – there are also surprising similarities in opinion dynamics across presidencies. These similarities reflect systemic variables that affect all presidencies. In later posts, I’ll take you through the intricacies of presidential polling to see if we can understand the source of these numbers, and why all presidents almost without exception become less popular over time. I’ll also explain why the news media almost always misinterprets these numbers.

For now, however, Obama should enjoy the honeymoon. It won’t last forever.  And leave that toilet seat down!