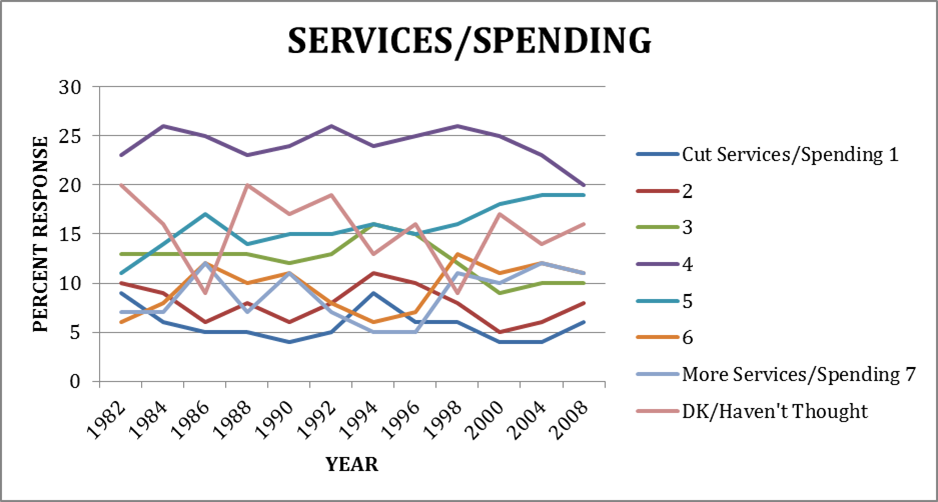
In Monday’s post I took issue with Vox founder Ezra Klein’s claim that, in his words “the idea of the moderate middle is bullsh*t.” You will recall that Ezra argues that indexes purporting to show the existence of a moderate middle are misleading, because they are often amalgams of ideologically extreme opinions. But we don’t need to rely on indexes as evidence that many Americans have moderate policy views – we can look at their responses to specific survey questions. The American National Election Studies (ANES) researchers have been asking Americans about their opinions on issues for several decades now. Typically the question starts by giving the respondent two policy extremes and then asks her to place herself somewhere on a 7-point scale anchored at either end by the extreme responses. As an example, here is a question asking individuals their views regarding government spending on services: “Some people think the government should provide fewer services, even in areas such as health and education, in order to reduce spending. Other people feel that it is important for the government to provide many more services even if it means an increase in spending. Where would you place yourself on this scale, or haven’t you thought much about this?”
Day Robins tabulated the responses to five of those questions for which we have data across time, including the government spending/services question. In each case the moderate, or middle response (Option 4) is typically the modal response, or close to it, across the entire survey history. (Note: although researchers often group the “don’t know/haven’t thought about it” bottom response with the moderate/middle answer, Day has not done so here. So the charts below likely understate the number of respondents adopting the moderate position.)
Here’s the government spending/services time trend.
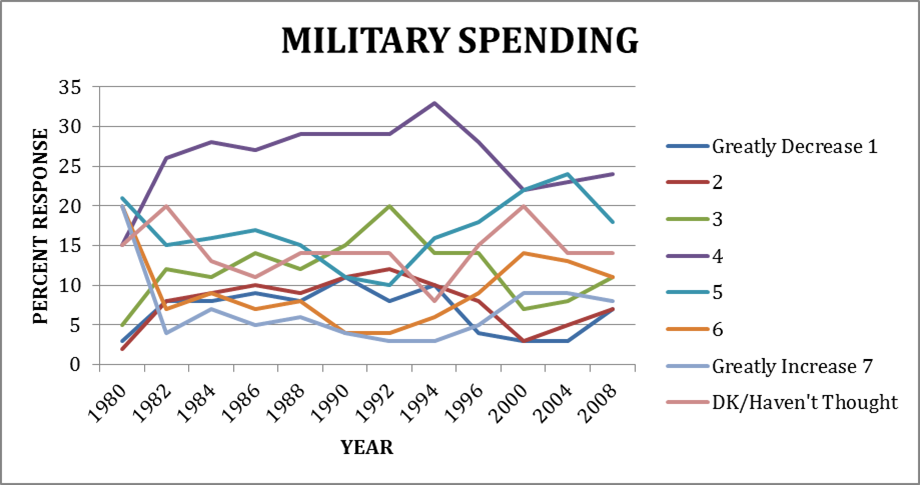
As you can see, even without including the “don’t knows” the most frequent response across a quarter century has been the middle, moderate choice. (The second most frequent response in recent years is 5.) For the most part, we see the same general pattern on the other four questions Day has graphed; the moderate position is typically the modal response. Here’s the graph of responses regarding whether to increase military spending.
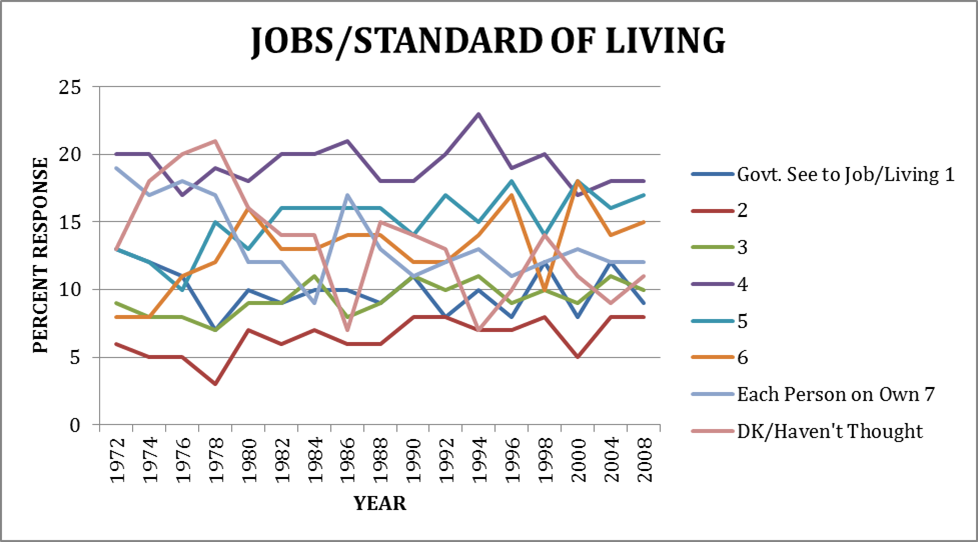
Here’s one asking about government creation of jobs.
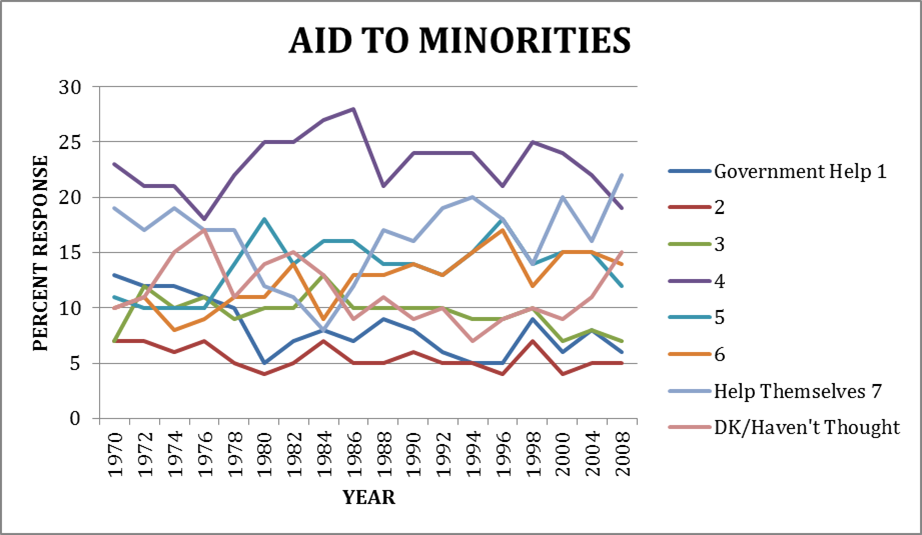
This one addresses aid to minorities. For most of the time period the moderate position holds sway, although in 2008 it is slightly eclipsed by option 7 “Help themselves”.
Finally, here’s one measuring support for government health insurance. Here option 1 – strong support for government health insurance is marginally preferred to the moderate position in the 2008 survey. But note that support for the moderate position has actually been increasing, while option 7 – private coverage – has lost support.

Now, before Max Kagan jumps all over me, these graphs are not evidence that most Americans are moderates across all issue areas. In fact, it is quite possible that their views vary depending on the issue. But the graphs do suggest that for most of the time on each of these issues, a plurality of Americans stake out a moderate position, with the exception of whether the government should provide health insurance and, in 2008, aid to minorities. And this is without including the “don’t knows/haven’t thought about it” response with the moderate answers. If we lump those in, as Abrams and Fiorina do for the 2012 responses to these questions, the moderate views appears even more popular.
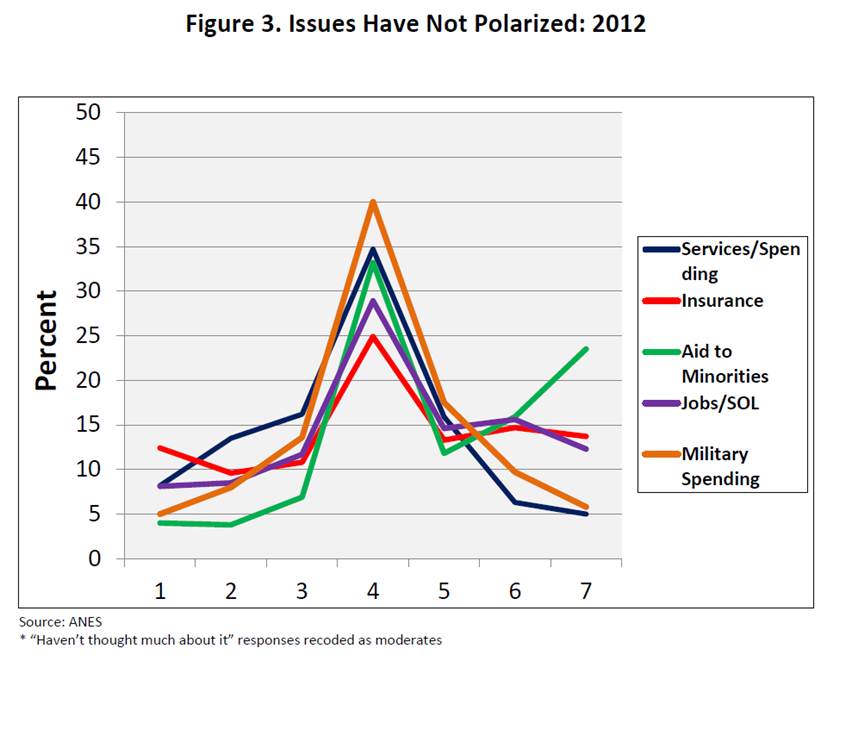 Moreover, on three of these issues across most of the time period – government services, jobs, and military spending – the responses are normally distributed, with most responses clustered around the center of the ideological spectrum, similar to what the Abrams/Fiorina graph shows for 2012. The government health insurance answers skew slightly liberal, and the aid to minorities responses are weighted more to the conservative side of the response distribution. If Americans were becoming more polarized, we might expect to see a decrease in the number of Americans adopting a centrist position, and increases in those choosing more extreme positions, on these issues. On the other hand, if what most pundits describe as ideological polarization is really party sorting, then I think we’d be more likely to see the graphs that Day has compiled.
Yes, at the individual level many Americans hold contradictory and sometimes extreme positions. But many hold moderate views too. And, in the aggregate, at least on these five issues, most respondents across much of the last quarter century cluster at or near the middle of the ideological spectrum. Yes there is some movement across responses categories. But it is hardly enough to lend credence to the notion that the moderate middle is a myth. And it is consistent with the notion that there has been no significant growth in ideological polarization.

