
Politico magazine has published a slightly revised version of my earlier post analyzing the highly publicized Pew Research Center survey that so many media outlets portrayed as evidence that we are living in “the divided United States of America”. (Note: I did not choose the Politico headline, which was a bit more provocative than is probably necessary. But I suppose it drives more traffic that way. It also wasn’t actually the final version I sent them – that version included “Jenny North” as one of my baby boomer archetypes. But no matter – the message is the same. ) I’ll have more to say about some of the Pew survey results, but for now these two interactive graphs tell much of the story. This first graph is what most of the media focused on.

The second graph below is of the general population as a whole – it shows that most Americans still possess a mix of conservative and liberal views, based on the survey responses recorded by Pew to ten values-based questions (they are listed below) they have asked repeatedly since their 1994 survey. Indeed, as the Pew Report authors acknowledge, “To be sure, those with across-the-board liberal or conservative views remain in the minority; most Americans continue to express at least some mix of liberal and conservative attitudes.”

If you hit the interactive button on the original page for this graph, you’ll see that there is a slight leftward shift in the peak of the distribution across two decades toward “consistently liberal”. What appears to be primarily driving that leftward movement are Americans’ responses to two questions among the ten Pew uses to construct their ideology measure. Here are the ten questions:
http://www.people-press.org/files/2014/06/PP-2014-06-12-polarization-A1-01.png
The first question on which aggregate opinion has moved in the liberal direction addresses attitudes toward homosexuality. As this graph put together by Middlebury student Tina Berger shows, Americans have become increasingly accepting of homosexuality since 1994, with about 62% in 2014 agreeing “that homosexuality should be accepted by society”, an increase of 16% choosing this response compared to 1994, and 12% above the average agreeing with this statement during the 20-year interval. This appears to be a long-term sustained trend in the liberal direction that started in the mid-1990’s, and it’s not clear if or when it will level off.
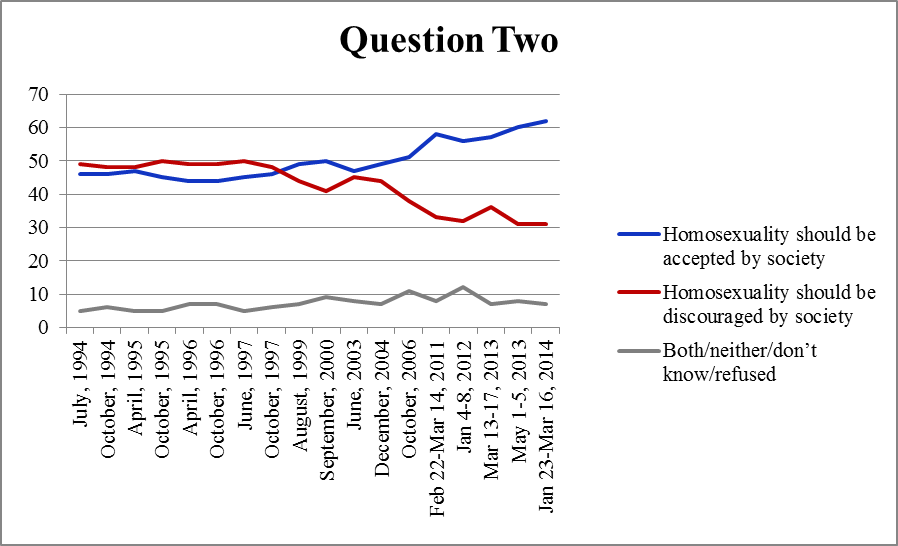 Source: Pew Research Center 2014 Political Polarization and Typology Survey Final Topline, page 16.
The second factor shifting the modal peak to the left is the public’s changing views toward immigration. Today 57% of Pew respondents agree that “Immigrants today strengthen our country because of their hard work and talents” – a figure that is up almost 13% from the 20-year average, and up 26% compared to 1994. To be sure, the trends aren’t uniform, but over two decades the net movement has been toward the liberal response.
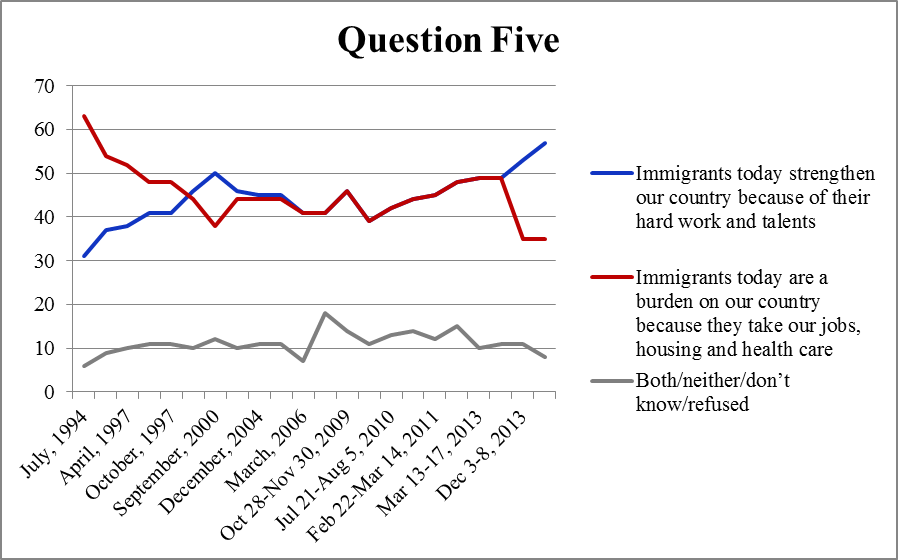 Source: Pew Research Center 2014 Political Polarization and Typology Survey Final Topline, page 9.
On the remaining eight questions, however, there is very little sustained consistent movement in the aggregate in either a liberal or conservative direction. Of course, this can’t tell us what is happening at the individual level. The Pew summary indicates a doubling since 1994 of those holding ideological consistent views, with 21% expressing “either consistently liberal or conservative opinions across a range of issues – the size and scope of government, the environment, foreign policy and many others.” This means most Americans, by Pew’s standard, still hold a mix of views, at least based on responses to these ten questions. And, on most issues, it does not appear that in the aggregate views have changed all that much across two decades. Again, this suggests that despite the media focus on evidence that Americans are growing increasingly divided, the details of the Pew survey results suggest a more complex and perhaps reassuring picture.
In sum, while it appears Americans’ views have become more liberal in regards to immigration and homosexuality since 1994, it is not clear whether this means, as some have claimed, that the country is “moving left”. It’s all in how you parse the data.
Matt:
Let me begin by saying that the graph style is new to me; as a person with both a business and law degree, and also a recovering trial lawyer, I thought I had seen every style of graph in the world. I will be using this style, as will other lawyers in my firm.
The data is especially interesting to me because I view myself as a moderate Republican, and both questions that affect the changes are ones in which I have moved to the left. I suspect most of my friends and colleagues fit into that group as well.
To what extent do you believe those two issues have driven the outcome of political races in America? And, in the future? Those are the questions that beg to be answered.
Shelly,
It is clear that both issues matter a great deal to the activists who fund and participate beyond simply voting in electoral politics. So in this sense they do affect the outcome of political races. I’m not sure, however, that among rank-and-file voters that the evolving views on gay rights and immigration matter all that much in terms of influencing their votes. I say this because most of the polling data suggests these issues aren’t high on voters’ priorities. Still, you could make the case that immigration has and will continue to loom large in certain states where it is perceived as a more important issue (see Arizona and Texas for recent headlines on this point) and that it could conceivably play a greater role looking toward the 2016 race. I probably should dig up some data and give this a closer look. Excellent question….
Professor Dickinson,
I realize that one-dimensional issue spaces are convenient for methodological reasons, but looking at these ten questions I am once again frustrated by such a simplistic framework. The issue goes beyond my personal frustration that my views cannot be easily categorized as belonging to either camp.
The data, I think, are misleading for the following reason: the average of a set of extreme viewpoints does not equal moderation in any meaningful sense. Imagine a diehard libertarian. He would likely come out as slightly “conservative” on many issues, but would also express a strong affinity towards “liberal” positions on gay rights, open borders, and perhaps foreign policy. Does he “average out” to be a center-right moderate conservative? I would certainly say not. I know you’re probably tired of me beating this (hopefully not yet dead) horse, but I really believe Brockman is right on this account.
At any rate, why can’t the most advanced subfield of political science can come up with a better framework! I could envision a Cartesian plane with a social dimension and an economic dimension. I realize Arrow’s Impossibility Theorem means such a scale would sacrifice predictive power, but I’d rather more analytical nuance and less of what seems to me blatant hucksterism and semi-informed prognostication.
Max,
You make a number of very useful points, some of which I have also just made in a twitter response to an exchange initiated by Alan Abramowitz in response to my Politico story on polarization. Regarding dichotomous choice sets – the authors of the Pew survey make exactly the same observation, but to suggest a different point. They note that an “extremist” ideologically speaking, can possess very liberal views on some issues, and very conservative ones on others, and thus would fall within the “mixed” category, but that this is not the same as being moderate. I find it hard to believe that very many people carry extreme views on both ends of the ideological spectrum, however. Instead, I think dichotomous response sets tend to oversimplify the more nuanced and, yes, moderate views that many people have on complicated issues – and this goes not just for surveys on values, but on election choices as well. So, as I just tweeted, we need to be very careful in inferring that Americans are polarized based on survey and election results that are based on choosing between two extreme options, be it values or candidates. Finally, I would point out that the DW-nominate scores do, in fact, have room for a second dimension to explain voting in Congress, but that this second dimensions, be it members’ views on civil rights or something else, don’t appear to be quite as powerful in predicting votes as does the basic left/right role of government dimension. Of course, this only applies to legislators’ votes – when we get down to Joe and Jane Six-pack, it is less clear that they possess well defined political views. I should probably devote a post to this topic, including a discussion of Brockman’s argument. But this shouldn’t stop you from flaying that poor horse!