by E. L. Pool and D. Copeland (with edits by R. Sandwick and M. J. Simpson)
Learning Goals
- Practice handling hazardous chemicals safely;
- Use a bunsen burner to heat a solution;
- Vacuum filter a solution;
- Practice using a transfer pipet and a mortar and pestle;
- Manipulate experimental conditions to illustrate the concept of limiting and excess reagents;
- Use Beer’s Law to create and apply a calibration curve for quantitative analysis;
- Consider the consequences of the limitations of the spectrophotometer and the analytical balance.
Introduction
You will use spectrophotometry to determine the amount of iron in a multivitamin to see if the manufacturer’s claim is correct. Iron itself is not a huge absorber of light, but when it (in solution in the Fe2+ form) binds to 1,10 phenanthroline (C12H8N2), it forms a highly stable red/orange-colored species. By quantifying the color with spectrophotometry, we can deduce the concentration of iron in the solution and back-calculate the amount of iron in the original pill. This can be compared to the manufacturer’s claim.
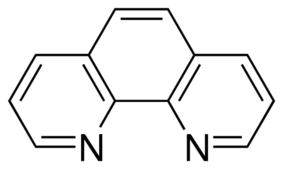 1,10 Phenanthroline
Background
The formation of the red/orange-colored iron-phenanthroline complex requires the iron to be in the Fe2+ form, and the procedure thus includes the reagent hydroxylamine hydrochloride (NH2OH ● HCl) that will reduce all iron in the sample to the ferrous form. Sodium acetate (NaC2H3O2) is used to control the pH of the solution since this also affects the absorbance.
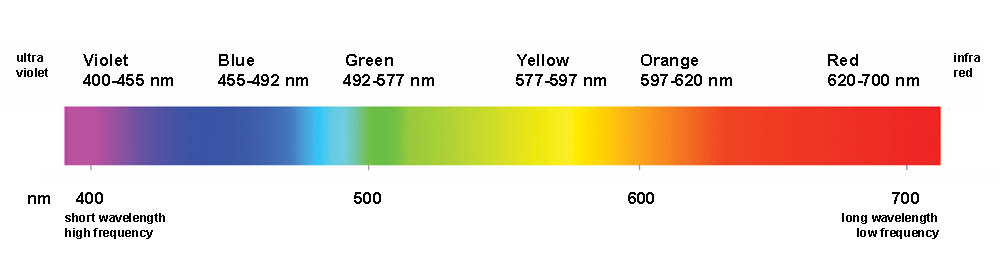
The red/orange iron-phenanthroline complex absorbs light at 508 nm, which is green light. This should make sense if you remember the Kool-Aid lab. To quantify the intensity of the color, you can use the spectrophotometer to measure the “absorbance.”
A key assumption in this experiment is that all of the iron will be converted to the colored complex, meaning there must be excess phenanthroline present. In preparation for the experiment, you will analyze the effects of varying the amounts of the two reagents that are directly involved in the production of the colored complex: the iron and the phenanthroline. This will show you the conditions under which this assumption is valid (or not!).
Once you measure the absorbance of the pill solution, how will you know how to correlate the absorbance with a concentration? One way is to know the extinction coefficient and to plug the appropriate numbers into Beer’s law. Another way is to prepare iron standards and to generate a standard curve of absorbance versus iron concentration. This latter technique is preferred as it accounts for any small changes one might have in her/his particular laboratory situation. We will use this method in our iron determination.
An online tutorial of this lab is available here.
Procedure
Note: do this lab with a partner.
Sample (Unknown) Preparation
The sample preparation requires crushing a pill, boiling the powder in acid to release the iron, and filtering the solution to remove particulates that could interfere in the spectrophotometry measurements.
- Each pair should obtain one vitamin pill. Determine the mass of the pill. Using a mortar and pestle, crush the pill into a fine powder. (You can take your angst out on the pill, but be careful none of it escapes the mortar.) Transfer the pulverized pill powder quantitatively to a 400 mL beaker. Determine the mass of the powder. In your final calculations, you will need to scale up your final iron concentration in the pill to account for any powder that you did not use.
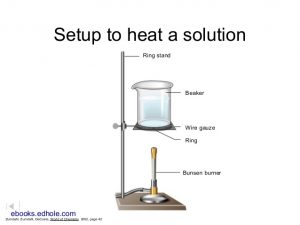
Apparatus to heat a solution
- Add approximately 150 mL of 1.0 M hydrochloric acid (HCl) [CAUTION!]. Add a few boiling chips. Use an apparatus similar to the illustration to heat the solution to near boiling (simmer) and keep heating at that temperature for 10 minutes. Do not leave your solution unattended. Avoid loss by splattering. Record observations about the appearance of your solution.
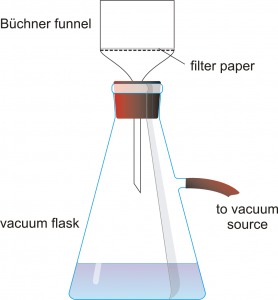
- Set up a vacuum filter apparatus with a Buchner filter, a vacuum flask, and a piece of filter paper. Hold the flask firmly or clamp it to a ringstand so it does not tip over. Pour 50 mL of DI water through the filter first, then turn on the vacuum and pour the hot solution through the filter. Your final solution should be clear and yellow. Record observations about the clarity of your solution in Table 3.
- Pour the filtered solution into a volumetric flask. Dilute to exactly 1.000 L with distilled water and mix thoroughly.
Solution Preparation
- Label 7 clean test tubes with the concentration of iron that they will contain (in units of mg/L): 0, 5, 10, 15, 20, 25, and the unknown vitamin solution.
- Label 4 small beakers with the reagents you will acquire from the stock solutions: sodium acetate, hydroxylamine HCl, 1,10-phenanthroline, and DI water. Fill these beakers with about 10 mL of their respective reagent. Put a plastic pipet in each.
- To each test tube, add 1 mL of each: sodium acetate, hydroxylamine HCl, and 1,10-phenanthroline. Note: you are using a concentrated phenanthroline solution that ensures it is in GREAT excess.
- To each test tube, add appropriate amounts of water and/or 25 mg/L iron stock solution to make a total of 5 mL of the concentration of iron specified on the label. Record the amounts of water and iron stock solution you used in Table 4. In the vitamin solution test tube, put 5 mL of the vitamin solution.
- Mix test tubes with gentle agitation and let the reaction complete for 10 minutes. Although you should use this time wisely, I advise against cleaning up, as you may need to remake a solution or two before the lab ends.
- Record observations about the color change and any trends you notice in Table 4. Note in your observations what concentration iron solution appears most similar to your vitamin sample. Pro-tip: these qualitative measurements should agree with your quantitative spectrophotometric measurements that you make in the next step. Your eyes are good spectrophotometers, and something is probably wrong if the quantitative measurements disagree with your visual inspection.
Spectrophotometric Analysis
- Get 7 clean cuvettes in a cuvette tray. Label them with the concentration of iron that they will contain (in units of mg/L): 0, 5, 10, 15, 20, 25, and the unknown vitamin solution. Transfer approximately 1 mL of each solution from its test tube to its corresponding cuvette.
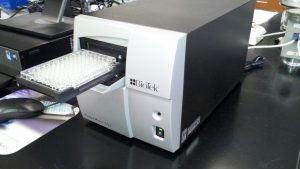
- Using a Spectronic 401 at 508 nm, read and record the Absorbance (A508) of your solutions. Record this data into Table 4.
Clean up
Check that your data in Table 4 increases linearly from low concentration of iron to high concentration of iron before cleaning up any part of your experiment. Ask your TA for help neutralizing the pill solution, then pour it down the drain. Pour the contents of the test tubes and cuvettes into the waste container. Throw away the cuvettes.
Data Analysis
The absorbance measurements of the standard solutions are used to determine the concentration of iron in the pill solution, which is used to determine the amount of iron present in the original pill. You can plot the concentration versus absorbance, then perform linear regression to find the formula that relates concentration and absorbance.
With this formula, you can simply plug in the pill solution absorbance and calculate the unknown concentration of iron in the pill solution. Using the concentration of iron in the pill solution, calculate the amount of iron present in the original pill. (Note: you will have to scale up your value to account for mass lost between the original pill and the pill powder.) You can then compare this value to the amount listed on the bottle in terms of percent error. The percent error is the absolute difference between the experimental and theoretical value divided by the theoretical value, then multiplied by 100 to get a percent.
Report
Fill out this worksheet. Turn in either a paper or digital copy. Optional survey.

 Prepare a dilute salt water solution using approximately 0.1 g of NaCl per 100 mL of DI water. Take a small amount of your Kool-Aid packet. Mix with a few drops of water to make a dark-colored slurry. A good concentration is about 15% wt. Kool aid powder in water. Using a wooden stick, make a dot of the mixture on a rectangular piece of filter paper about an inch from the bottom. Wait for it to dry. If it is not clearly visible, make another dot in the same spot. You can accelerate the drying process by blowing air on it. Suspend the paper in a beaker containing a small amount of salt water using the same wooden dowel. Allow the filter paper to just touch the top of the water (you don’t want the water to touch the spot of Kool aid). Leave the paper in the water until the dye(s) sufficiently separate or until you are sure there is only one dye present (wait at least 10 minutes).