by S. F. Sontum and K. Jewett (edited by R. Sandwick)
Introduction
The oxides of carbon could not be more chemically different. Carbon monoxide (CO) is a polar basic gas that binds strongly to metals while carbon dioxide (CO2) is a non-polar gas that reacts with water. Carbon monoxide is produced when hydrocarbons are burned in a limited amount of oxygen while carbon dioxide is produced when hydrocarbons are burned in excess oxygen. Carbon monoxide is a deadly poison while carbon dioxide is essential to the metabolism of plants and animals.
Carbon dioxide is the fourth most common gas in our atmosphere and its concentration is increasing. Atmospheric carbon dioxide plays an important role in maintaining surface temperatures. It is one of the “greenhouse” gases responsible for global warming. The biological processes of metabolism, which produces carbon dioxide, and photosynthesis, which consumes carbon dioxide have functioned to maintain the levels of carbon dioxide in our atmosphere. The industrial revolution has shifted this balance. The concentration of carbon dioxide has increased more than 30% to the present day value of 400 ppm. Global temperatures are rising.
This experiment focuses on a physical property of CO2 – its energy content, and a chemical property of CO2 – its ability to dissolve in water to make the solution acidic. Like all molecules CO2 stores potential energy in the molecular bonds that hold the oxygen to the carbon and in the intermolecular forces between molecules. We will measure the heat of sublimation of dry ice to investigate the intermolecular forces between CO2 molecules.
The phase diagrams below indicate the stable forms of compounds at different pressures P and temperatures T. The lines describe when two phases are in equilibrium and the triple point is the place where all three phases can coexist in equilibrium. For example, the triple point of water occurs at 0.01 oC and 0.006 atm. In order to convert ice directly into steam the partial pressures of water would have to be lower than 0.006 atm. Because we live at higher pressures (i.e., at 1 atm), we always see ice melt before it vaporizes to steam. The process of converting a solid to its liquid is called melting (aka, fusion). The triple point of carbon dioxide on the other hand occurs at a much higher pressure and lower temperature, -57 oC and 5.11 atm. We call solid carbon dioxide “dry ice” because at normal atmospheric pressures it converts directly from the solid into the gas. The process of converting a solid into a gas is called sublimation. Both melting and sublimation require the input of heat.
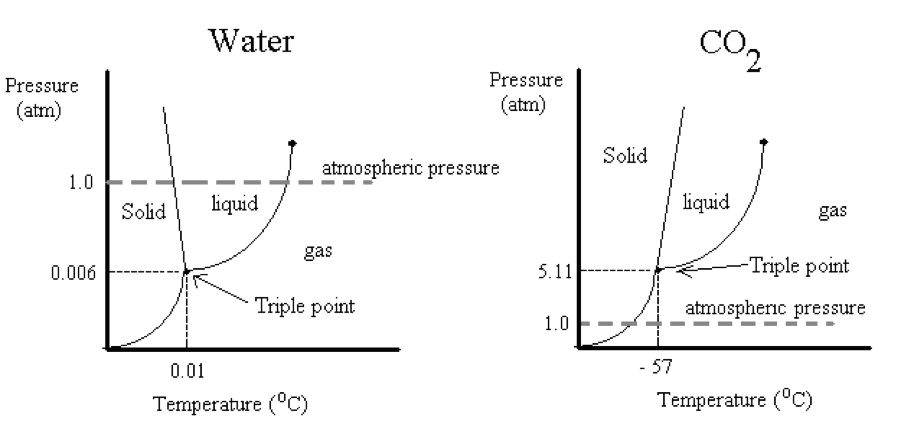
Phase diagrams
Calorimetry
When a solid substance is heated, it absorbs thermal energy and its temperature increases. When the melting point of the substance is reached, addition of further thermal energy breaks up the forces holding the solid together, and a liquid begins to form. A balance is established between solid and liquid, and as more thermal energy is added the temperature remains constant while the amount of solid decreases and the amount of liquid increases. The heat absorbed when one mole of solid is melted at constant pressure is called the molar enthalpy of fusion (Δ Hfus). When heat is absorbed, the sign of Δ Hfus is, by convention, positive. Reactions that absorb heat are said to be endothermic reactions. Those which produce heat are said to be exothermic.
On the molecular scale, many processes occur as the ice absorbs heat: the ordered array of molecules in the crystal lattice of the solid is broken down into a collection of mobile, disordered liquid-phase molecules. The water molecules in ice are also losing potential energy associated with intermolecular forces between molecules and gaining kinetic energy of motion. Meanwhile, the temperature of the water, associated with the average kinetic energy of motion, rises as the molecules move about and vibrate more rapidly.
The change in internal energy for a reaction Δ Erxn can be measured by running the reaction in a constant volume bomb calorimeter. By designing the calorimeter so that no heat leaks out to the surroundings, the heat absorbed by the reaction should equal the heat lost by the calorimeter. The heat absorbed by the calorimeter can be measured by the heat capacity of the calorimeter (Ccalorimeter) times the change in temperature.
Δ Erxn = – Ccalorimeter Δ T
The melting of ice or the sublimation of carbon dioxide is not a constant volume process but rather a constant pressure process. To investigate the heat flows in a constant pressure process we will have to define a new form of internal energy called enthalpy, H. At constant pressure the change in enthalpy is related to the change in internal energy minus the work done on the system due to volume changes (Δ V).
ΔH = ΔE + Δ(PV) = ΔE + PΔV
At constant pressure, enthalpy changes are a direct measure of the heat absorbed by the system. Enthalpy changes are easier to measure than internal energy changes because it is easier to maintain the constant pressure than constant volume.
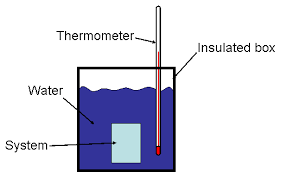
Diagram of a constant pressure calorimeter
Δ H is measured with a calorimeter where the amount of heat flowing is reflected in a temperature change of a known mass of water. In fact, the unit of energy, the calorie, has been defined to be that amount of heat that will raise one gram of pure water one degree Celsius in temperature. Although the calorie is convenient energy unit, the scientific community now uses the Joule as its standard unit of energy. (1 cal = 4.184 J) Assuming no heat loss during the transfer, the heat of a reaction will be equivalent to the heat absorbed by g grams of water when the temperature raises Δ T degrees Celsius, or
ΔHrxn = – g H2O (4.184 J/g H2O oC ) ΔT
This is the basic equation describing a solution calorimeter that is intended to measure the change in enthalpy during a constant pressure process.
Enthalpy of Reaction (see Hess’s law in the textbook)
Sometimes it is difficult or even impossible to measure an enthalpy of formation directly. In this experiment we will be determining the enthalpy of formation for CO32-(aq).
C(s) + 3/2 O2(g) + 2 e– → CO32-(aq)
Direct measurement by burning C(s) in oxygen would not give us carbonate, so we will be using an indirect method. According to Hess’s Law (the conservation of enthalpy), if two or more reactions can be added to give a net reaction, Δ H for the net reaction is simply the sum of the Δ H’s for the reactions which are added (energy is additive). Consider the following four reactions:
(1) 2H+(aq) + 2e- → H2(g) Δ H1
(2) CO32-(aq) → C(s) +3/2 O2(g) + 2e- Δ H2
(3) H2(g) + 1/2 O2(g) → H2O(l) Δ H3
(4) C(s) + O2(g) → CO2(aq) Δ H4
(5) 2H+(aq) + CO32-(aq) → H2O(l) + CO2(aq)
Δ H5 = Δ H1 + Δ H2 + Δ H3 + Δ H4
You will measure Δ H5 directly. We will combine this with the literature values for the heats of formation of H+(aq), H2O(l), and CO2(aq).
H2(g) + 1/2 O2(g)(g) → H2O(l)
Δ H3 = Δ Hfo (H2O(l))= -285.83 kJ/mole
C(s) + O2(g)(g) → CO2(aq)
Δ H4 = Δ Hfo (CO2(aq))= -413.80 kJ/mole
H2(g) → 2 H+(aq) + 2 e-
-Δ H1 = 2 x(Δ Hfo (H+(aq))= 2 x 0 kJ/mole
You will thus be able to calculate Δ H2, which is the enthalpy of formation of CO32-(aq) reaction written backwards.
Bomb Calorimetry
Not like this bomb
As we said above, the daily caloric intake of an adult is about 3000 kcal/day. To maintain an energy balance an average adult consumes six tons of solid food over a 40 year period, which amounts to about 12.5 g/hr. Typically we obtain one third of our energy from each primary type of food substance — carbohydrates, proteins and fat. The average enthalpy content of carbohydrates and proteins are about the same (4 kcal/g) while fats average twice as much (9 kcal/g). We will measure the caloric content of food directly by using a bomb calorimeter. We will run a one-gram sample of food in the bomb calorimeter, determine its heat of combustion, and compare the value with what the package says is its caloric content.
Experimental Procedures
Part 1 Enthalpy of Sublimation
Clean, dry, and weigh the calorimeter (2 styrofoam cups, one inside the other – the inner cup will have a series of holes, plus the cover with one hole taped closed).
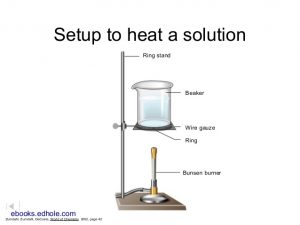
Fill a 100 mL volumetric flask to the mark with distilled water adjusted to room temperature and weigh it. Place a split-holed rubber stopper carefully over the top of the high precision thermometer. Carefully insert the thermometer into the volumetric flask and stabilize the thermometer by attaching the split-holed stopper to a ring stand via a Bunsen burner clamp. Record the stable temperature; this is the starting temperature of the water.
Once you have weighed the calorimeter and measured the stable temperature reading, take a piece of CO2 (between 2 and 10 grams) with tweezers and put it between the two cups and weigh the entire assembly. The mass will keep rolling down as it sublimes, therefore after a few seconds record the mass, not bothering with the last digit, immediately take the assembly back to your station where your partner has the thermometer ready to put through the cover. Pour the 100 mL of water into the cups, replace the cover, and gently push down, trying not to spill too much water as it seeps into the lower cup. Reweigh volumetric flask to determine the mass of water transferred.
Even though you see your system “smoking”, the “smoke” shouldn’t be cold to the touch as the CO2 gas has to absorb the heat of the water as it travels through it. Swirl the cups gently, again making sure to hold the two cups together as much as possible and to keep the cover on. Watch the temperature drop. When it stabilizes and you don’t feel the bubbles in solution, swirl again and look in the calorimeter. If it’s cloudy, return to swirling. If it’s clear, record the stabilized temperature.
Empty your calorimeter and thoroughly dry the cups, cover, and thermometer. Repeat the experiment. Calculate enthalpy.
Calculations: The heat gained by the CO2 (Δ Hsub) is equal to the heat released by the water. Knowing that the specific heat of water is 4.184 J g-1 Co, calculate the average ΔHsub/g CO2 and the average Δ Hsub/mol CO2. Compare versus the literature value.
Part 2 Enthalpy of Reaction for formation of H2O and CO2 from CO32- and H+
The calorimeter and thermometer setup will be two small cups, the same size, with no holes. Rinse the inner cup of your calorimeter with distilled water and dry the cup, cover, thermometer and stirrer thoroughly.
- Obtain 100 mL each of the 1.00 M solution of K2CO3 and the 3 M HCl in clean, dry, labeled beakers.
- Add exactly 50.0 mL of your solutions to each of two 50 mL volumetric flasks. Weigh both. Load the calorimeter with the 50.0 mL of 3 M HCl , then reweigh the volumetric flask. Insert the thermometer into the 50 mL of K2CO3 solution and determine the initial temperature. Rinse the thermometer and assemble the calorimeter (thermometer and cover).
- Begin measuring the temperature of the HCl solution and record the temperature every 15 seconds. After the temperature stabilizes (three consistent measurements), add the K2CO3 solution at a moderate pace so that it does not bubble out (but within 10 seconds), then re-cover the calorimeter. Swirl the solution to release all CO2 and continue recording the temperature until it is approximately constant for several readings (at the end you may see a slight decrease due to heat leakage). Reweigh the 50.0 mL K2CO3 volumetric flask to determine how much was transferred.
Carefully empty the calorimeter and clean the cup, cover, and thermometer. Rinse the cup with distilled water. Dry all pieces thoroughly. Repeat the experiment once a second time. Record your data in a table.
Calculations: Assume the mixture of the two solutions has the same specific heat as water (4.184 J g-1 Co) and perform a calculation similar to Part 1 to determine Δ Hrxn and then Δ Hrxn/ mol CO32-. (This is Δ H5.) Use Hess’s law to determine Δ Hf for CO32- (Δ H2 backwards). Compare ΔH2 to literature values.
Part 3 Bomb Calorimetry
Perform bomb calorimetry on a sample at some point during the lab period. Each pair of students should bring and be prepared to analyze a uniform dry (or chocolate) food sample using the bomb calorimeter. Weigh out one gram +/- .0005 g. Crush (if it’s dry) or break the sample into small pieces (if it’s chocolate) and fill the calorimeter pan. Procedures for using the Parr bomb calorimeter will be demonstrated in class.
Calculations: The read-out from the calorimeter will give you cal/grams. Remembering that a food calorie (Cal) is actually a kcal, compare your results to the value listed on the package.
Report
Complete the worksheet for your lab report. You should have all calculations clearly shown and your final results compared to literature values.


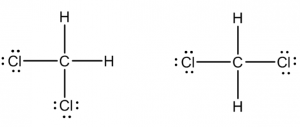
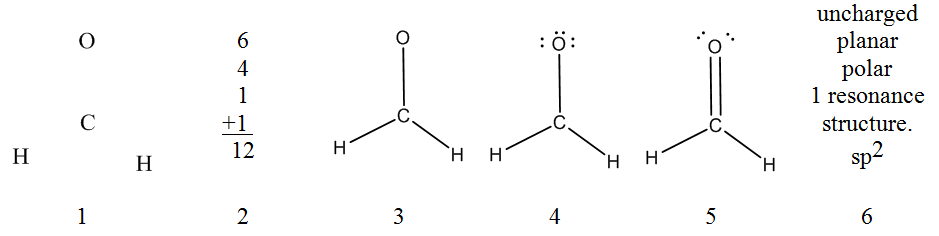
 software. It calculates 3D structures and molecular orbitals, which help chemists predict the chemical and physical properties of theoretical molecules. In this lab, you will use ChemDraw to analyze the structures of molecules in 3D.
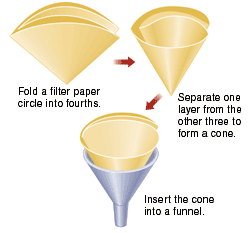


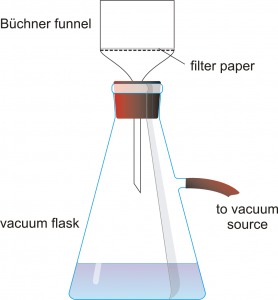 Obtain a Büchner funnel, a filter flask, and an appropriately sized piece of filter paper. Record the mass of the filter paper.
 splash or drip them on yourself.
 This video shows you some techniques:


 products. For example, an appropriate title of your project may be “An Investigation of the Comparative Glucose Concentrations of Two ____(fill in the blank)_________.” You can pick different products to compare or you might want to pick one product which somehow gets manipulated (temperature, storage, etc.). The plan obviously needs some discussion and some preliminary research of the literature (i.e., Does the product you intend to use actually have glucose in it?). Creativity is admired. The experiment cannot include the use of animals nor the use of human body fluids. The lab instructor will work with you to determine the feasibility of the project.